

HOT TOPICS LIST
- MACD
- Fibonacci
- RSI
- Gann
- ADXR
- Stochastics
- Volume
- Triangles
- Futures
- Cycles
- Volatility
- ZIGZAG
- MESA
- Retracement
- Aroon
INDICATORS LIST
LIST OF TOPICS
PRINT THIS ARTICLE
by Stella Osoba, CMT
Peleton Interactive Inc. (PTON), the once popular stationary exercise bike and interactive cycling classes provider was a darling stock in the consumer discretionary sector, having won the hearts of exercise enthusiasts and Wall Street types alike. But then the bubble burst and the stock went on to descend to single digit lows. After a downtrend of more than three years, is it now time to give PTON a second look?
Position: N/A
Stella Osoba, CMT
Stella Osoba is a trader and financial writer. She is a frequent contributor to "Technical Analysis of Stocks and Commodities" magazine and "Traders.com Advantage" as well as other financial publications.
PRINT THIS ARTICLE
TECHNICAL ANALYSIS
Is It Time To Give Peloton a Second Look?
01/23/25 03:49:19 PMby Stella Osoba, CMT
Peleton Interactive Inc. (PTON), the once popular stationary exercise bike and interactive cycling classes provider was a darling stock in the consumer discretionary sector, having won the hearts of exercise enthusiasts and Wall Street types alike. But then the bubble burst and the stock went on to descend to single digit lows. After a downtrend of more than three years, is it now time to give PTON a second look?
Position: N/A
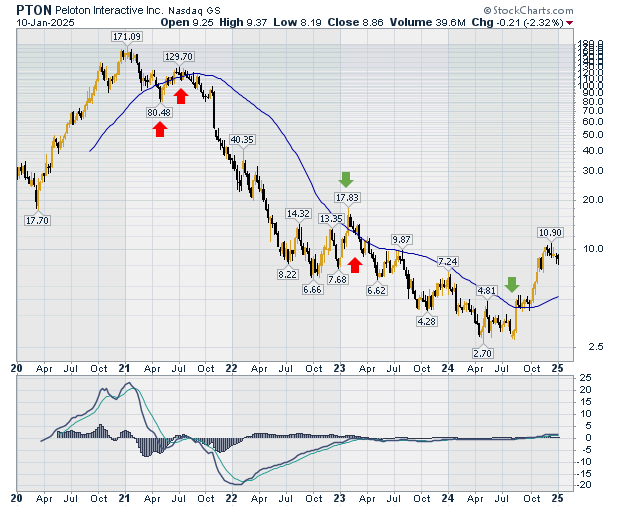
| Figure 1 is a longer-term weekly chart of PTON showing its steady decline from a high of $171.09 in January 2021, to a low of $2.70 in April 2024. Figure 1 displays the price action of the stock against the backdrop of the 50-day moving average and nothing else. Even though we have numerous technical tools at our disposal, it is often best not to clutter the chart for clarity and simplicity. |
|
| Figure 1. Weekly chart for PTON with the 50-day moving average. |
| Graphic provided by: StockCharts.com. |
| |
| If all we were using in our analysis was the 50-day moving average and a study of price action, it would not have led us astray. On the chart are green and red arrows. The red arrows show when price dips below the moving average and the green arrows shows when price moves above the average. If the dip below the 50-day moving average is a negative signal, then what would the first dip in May 2021 tell us? This dip is a signal. Nothing else. It is an alert to look for confirmation in price action. So, what does price do? It rises up to $129.70 in July 2021 and then breaks down, slipping once again below the 50-day moving average. This confirms the earlier signal. Price failed to rise above the January 2021 highs. So, were we so inclined, we could have entered a short trade here despite the likely positive news likely still surrounding the stock. |
| The price descent which followed the second dip below the 50-day moving average was unrelenting and must have been extremely painful for all those who expected buyers to step in and buy the dip. In July 2022 price looked to be forming the first shoulder of a head and shoulders pattern. The lows were $8.22 in July 2022 (Left shoulder), $6.66 in October 2022 (Head), and $7.68 in December 2022 (right shoulder). This inverse head and shoulders pattern failed after price broke above the 50-day moving average in January 2023 (see green arrow), traded for as high as $17.83 and then gave up the ghost. |
| The down trend was not done in January 2023 and price resumed its unrelenting decline for the rest of 2023. In April 2024, price traded as low as $2.70. This is when pessimism around the stock would have reached its highest. All those who had held onto the stock waiting for a turnaround had given up and taken their losses. But in August 2024, the low was higher than that in April 2024. This was the first signal that the stock might have reached its price low. If there were no more sellers to drive the stock's price lower, then maybe buyers would be able to do what they had been unable to do for the previous three years. |
| And so, they did. In August 2024, buyers succeeded in pushing up the price above the 50-day moving average. The stock sat on the 50-day moving average line for the next few weeks and then began to rise above it in a strong trend reversal. A break upwards from the current price reaction will show if this new uptrend is sustainable. |
Stella Osoba is a trader and financial writer. She is a frequent contributor to "Technical Analysis of Stocks and Commodities" magazine and "Traders.com Advantage" as well as other financial publications.
| E-mail address: | stellaosoba@gmail.com |
Click here for more information about our publications!
PRINT THIS ARTICLE

Request Information From Our Sponsors
- VectorVest, Inc.
- Executive Premier Workshop
- One-Day Options Course
- OptionsPro
- Retirement Income Workshop
- Sure-Fire Trading Systems (VectorVest, Inc.)
- Trading as a Business Workshop
- VectorVest 7 EOD
- VectorVest 7 RealTime/IntraDay
- VectorVest AutoTester
- VectorVest Educational Services
- VectorVest OnLine
- VectorVest Options Analyzer
- VectorVest ProGraphics v6.0
- VectorVest ProTrader 7
- VectorVest RealTime Derby Tool
- VectorVest Simulator
- VectorVest Variator
- VectorVest Watchdog
- StockCharts.com, Inc.
- Candle Patterns
- Candlestick Charting Explained
- Intermarket Technical Analysis
- John Murphy on Chart Analysis
- John Murphy's Chart Pattern Recognition
- John Murphy's Market Message
- MurphyExplainsMarketAnalysis-Intermarket Analysis
- MurphyExplainsMarketAnalysis-Visual Analysis
- StockCharts.com
- Technical Analysis of the Financial Markets
- The Visual Investor