HOT TOPICS LIST
- MACD
- Fibonacci
- RSI
- Gann
- ADXR
- Stochastics
- Volume
- Triangles
- Futures
- Cycles
- Volatility
- ZIGZAG
- MESA
- Retracement
- Aroon
INDICATORS LIST
LIST OF TOPICS
PRINT THIS ARTICLE
by Stella Osoba, CMT
Lemonade (LMND) is an insurance holding company headquartered in New York, NY. It recently completed the formation of a rounding bottom, or saucer, on its price chart.
Position: N/A
Stella Osoba, CMT
Stella Osoba is a trader and financial writer. She is a frequent contributor to "Technical Analysis of Stocks and Commodities" magazine and "Traders.com Advantage" as well as other financial publications.
PRINT THIS ARTICLE
ROUND TOP & BOTTOM
Lemonade's Rounding Bottom
01/09/25 05:06:17 PMby Stella Osoba, CMT
Lemonade (LMND) is an insurance holding company headquartered in New York, NY. It recently completed the formation of a rounding bottom, or saucer, on its price chart.
Position: N/A
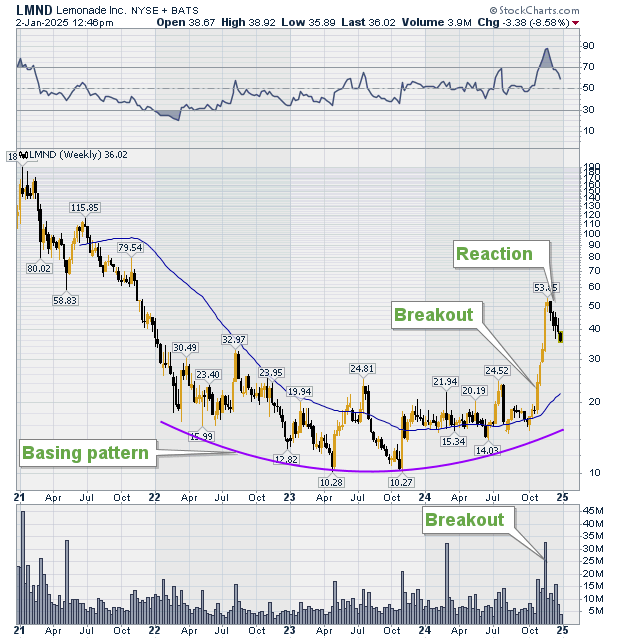
| The rounding bottom is a classic chart pattern. It is often very easy to spot in hindsight, but not so much during its formation. Figure 1 is a weekly chart showing four years of LMND's price action. The rounding pattern is annotated on the chart. The rounding pattern was formed over a three-year time period when price halted a lengthy and steep decline. After two further price dips in the middle of the price pattern when price touched just above $10, price proceeded to slowly rise up to form the right side of the saucer. |

|
| Figure 1: Weekly chart for LMND. |
| Graphic provided by: StockCharts.com. |
| |
| If intending to trade the pattern, it is important to wait not just for the signal which is the pattern, but the breakout from the pattern which is confirmation. Not all rounding bottoms will form alike, some differences in the expectations of classic rounding bottom formations is to be expected. In this case, there is no handle to allow you to enter the trade. Instead, there is a powerful breakout which is the point after which the pattern is confirmed. |
| Breakout happens when there is a strong rise in price which takes it to above the high of the most recent high on volume that is at least two times that of the prior day. Figure 1 is a good example of this type of breakout. On October 31, 2024, after a gap up at the open, price rises forming a strong bullish candle. This price increase takes it above the prior high formed on October 18, 2024. Volume on the breakout day (October 31st) was over 9.6 million which was over three times the volume on the prior day (October 30) of 2.3 million. |

|
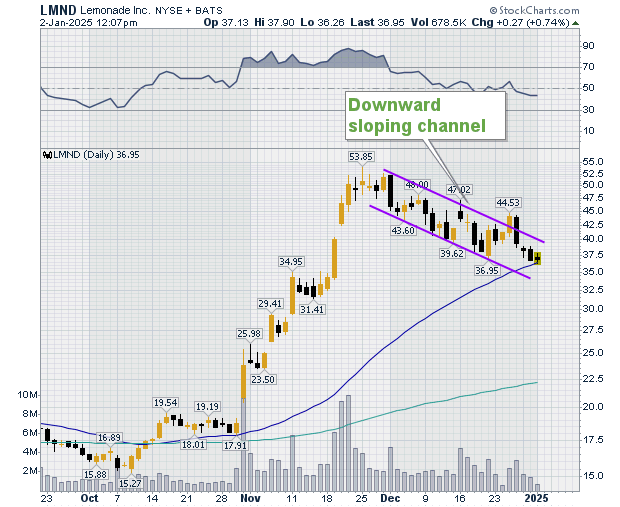
| Figure 2. Daily chart for LMND. |
| Graphic provided by: StockCharts.com. |
| |
| Figure 2 shows price action after the breakout. From the high reached the day before the breakout of $19.13 on October 30, 2024, to the highs before the first reaction after breakout on November 26, 2024, price rose 182%. Price is currently in a reaction and is touching the 50-day moving average. If price breaks above the channel shown on the chart in Figure 2, it is possible that the rise will match that of the price increase prior to entry into the channel. |
Stella Osoba is a trader and financial writer. She is a frequent contributor to "Technical Analysis of Stocks and Commodities" magazine and "Traders.com Advantage" as well as other financial publications.
| E-mail address: | stellaosoba@gmail.com |
Click here for more information about our publications!
PRINT THIS ARTICLE

|

Request Information From Our Sponsors
- StockCharts.com, Inc.
- Candle Patterns
- Candlestick Charting Explained
- Intermarket Technical Analysis
- John Murphy on Chart Analysis
- John Murphy's Chart Pattern Recognition
- John Murphy's Market Message
- MurphyExplainsMarketAnalysis-Intermarket Analysis
- MurphyExplainsMarketAnalysis-Visual Analysis
- StockCharts.com
- Technical Analysis of the Financial Markets
- The Visual Investor
- VectorVest, Inc.
- Executive Premier Workshop
- One-Day Options Course
- OptionsPro
- Retirement Income Workshop
- Sure-Fire Trading Systems (VectorVest, Inc.)
- Trading as a Business Workshop
- VectorVest 7 EOD
- VectorVest 7 RealTime/IntraDay
- VectorVest AutoTester
- VectorVest Educational Services
- VectorVest OnLine
- VectorVest Options Analyzer
- VectorVest ProGraphics v6.0
- VectorVest ProTrader 7
- VectorVest RealTime Derby Tool
- VectorVest Simulator
- VectorVest Variator
- VectorVest Watchdog
