HOT TOPICS LIST
- MACD
- Fibonacci
- RSI
- Gann
- ADXR
- Stochastics
- Volume
- Triangles
- Futures
- Cycles
- Volatility
- ZIGZAG
- MESA
- Retracement
- Aroon
INDICATORS LIST
LIST OF TOPICS
PRINT THIS ARTICLE
by Stella Osoba, CMT
On October 17, 2024, Netflix (NFLX) reported quarterly earnings and beat analysts' estimates for revenue and earnings leading to a surge in its stock price. Does NFLX shares still have room to run?
Position: N/A
Stella Osoba, CMT
Stella Osoba is a trader and financial writer. She is a frequent contributor to "Technical Analysis of Stocks and Commodities" magazine and "Traders.com Advantage" as well as other financial publications.
PRINT THIS ARTICLE
TECHNICAL ANALYSIS
Does Netflix Still Have Room to Run?
11/13/24 03:04:15 PMby Stella Osoba, CMT
On October 17, 2024, Netflix (NFLX) reported quarterly earnings and beat analysts' estimates for revenue and earnings leading to a surge in its stock price. Does NFLX shares still have room to run?
Position: N/A
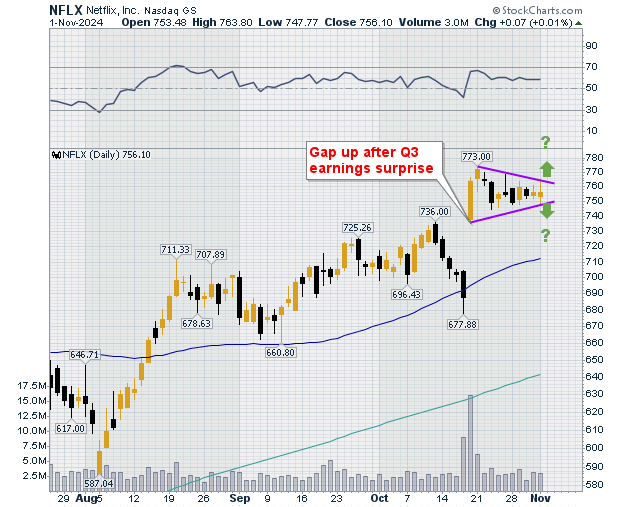
| Figure 1 is a daily chart of NFLX showing the gap up and strong bullish candle after NFLX's earnings beat. The stock closed at $687.65 on October 17, 2024, and the earnings announcement came after market close on that day. The announcement caused an immediate rise in the stock's price in aftermarket trading and the next day price reflected the optimism by gapping up and closing at $763.95 which was an almost 12% increase in the stock's price. |

|
| Figure 1. Daily chart for NFLX. |
| Graphic provided by: StockCharts.com. |
| |
| Price has since gone on to form a triangle price pattern as the price increase is absorbed by the market. A triangle is a short-term continuation price pattern. Because it is a continuation pattern, price is usually expected to leave the pattern in the direction in which it entered. In this case, price entered the pattern upwards and should therefore leave upwards. But remember this is only what is likely to happen, all price patterns can fail. |
| The green arrows in Figure 1 show price leaving the pattern either above or below. Each is a possibility, and until it actually happens, we have no way of knowing what price will actually do. To give us further information on the stock, let us pull back to include more price history. |

|
| Figure 2. Weekly chart for NFLX. |
| Graphic provided by: StockCharts.com. |
| |
| Figure 2 is a weekly chart of NFLX showing five years of price history. This chart allows us to see NFLX's prior high of $700 and subsequent decline which was steep and painful for those holding onto its shares. Price went from a high of $700.99 on November 1, 2021 to a low of $162.71 on May 9, 2022, a 76.7% decrease. Price then traded sideways until early July 2022 and proceeded to enter a sustained uptrend. See the green trendline in Figure 2. Price did not break above the November 2021 high until August 19, 2024. |
| In February 2024, the 50-day moving average crossed above the 200-day moving average forming a bullish golden cross and a continuation of the uptrend. So, with the uptrend currently about two and a half years old, can NFLX sustain this continued price increase? Even though stocks do not rise to the sky, there is optimism around NFLX stock buoyed by the current earnings surprise. It is possible that the trend will continue when price breaks out of the triangle. But with price, anything can happen. Continued analysis of the chart will reveal what happens next. |
Stella Osoba is a trader and financial writer. She is a frequent contributor to "Technical Analysis of Stocks and Commodities" magazine and "Traders.com Advantage" as well as other financial publications.
| E-mail address: | stellaosoba@gmail.com |
Click here for more information about our publications!
Comments

Request Information From Our Sponsors
- StockCharts.com, Inc.
- Candle Patterns
- Candlestick Charting Explained
- Intermarket Technical Analysis
- John Murphy on Chart Analysis
- John Murphy's Chart Pattern Recognition
- John Murphy's Market Message
- MurphyExplainsMarketAnalysis-Intermarket Analysis
- MurphyExplainsMarketAnalysis-Visual Analysis
- StockCharts.com
- Technical Analysis of the Financial Markets
- The Visual Investor
- VectorVest, Inc.
- Executive Premier Workshop
- One-Day Options Course
- OptionsPro
- Retirement Income Workshop
- Sure-Fire Trading Systems (VectorVest, Inc.)
- Trading as a Business Workshop
- VectorVest 7 EOD
- VectorVest 7 RealTime/IntraDay
- VectorVest AutoTester
- VectorVest Educational Services
- VectorVest OnLine
- VectorVest Options Analyzer
- VectorVest ProGraphics v6.0
- VectorVest ProTrader 7
- VectorVest RealTime Derby Tool
- VectorVest Simulator
- VectorVest Variator
- VectorVest Watchdog
