HOT TOPICS LIST
- MACD
- Fibonacci
- RSI
- Gann
- ADXR
- Stochastics
- Volume
- Triangles
- Futures
- Cycles
- Volatility
- ZIGZAG
- MESA
- Retracement
- Aroon
INDICATORS LIST
LIST OF TOPICS
PRINT THIS ARTICLE
by Stella Osoba, CMT
Generative Artificial Intelligence, which hit the scenes in the early 2020s, has become the latest tech craze. With these AI learning models set to change everything from how we work to how we shop, how exactly can an investor get a toe hold in this fascinating and fast-growing space?
Position: N/A
Stella Osoba, CMT
Stella Osoba is a trader and financial writer. She is a frequent contributor to "Technical Analysis of Stocks and Commodities" magazine and "Traders.com Advantage" as well as other financial publications.
PRINT THIS ARTICLE
SYMMETRICAL TRIANGLE
Getting In On The AI Boom
10/16/24 03:41:45 PMby Stella Osoba, CMT
Generative Artificial Intelligence, which hit the scenes in the early 2020s, has become the latest tech craze. With these AI learning models set to change everything from how we work to how we shop, how exactly can an investor get a toe hold in this fascinating and fast-growing space?
Position: N/A
| Microsoft Corp. (MSFT) has been investing heavily in AI and owns a 49% percent equity stake in Open AI which is the maker of the eponymous ChatGPT. On October 2, 2024, OpenAI announced that it had raised $6.6 billion in venture capital funding raising the valuation of the company to $157 billion or roughly double of what it was valued at a year ago. |
| With such rich valuations coupled with the enthusiasm surrounding this technology, getting in on it might not be such a bad idea. MSFT invested $1 billion in the latest round of funding for OpenAI bringing its total investment in the start-up to $13 billion. With its sizeable equity stake in the company, owning MSFT stock is a strategic way to gain exposure to the AI industry. |
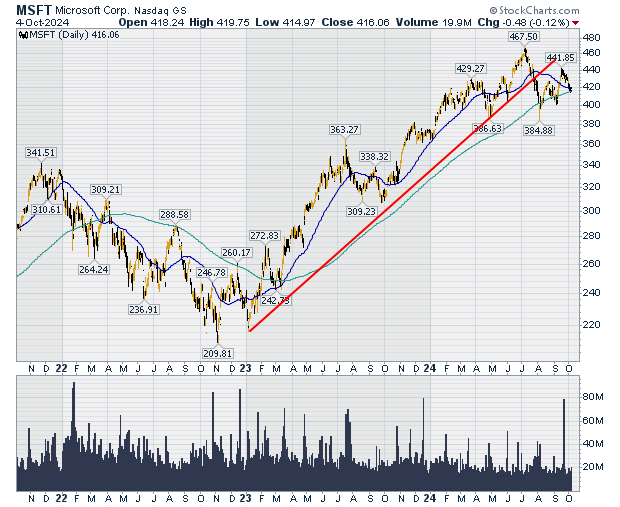
| Figure 1 is a daily chart of MSFT showing 3 years of price history. After forming a double bottom between November 2022 and January 2023, MSFT entered an uptrend rising from $209 to $467.50. We can see the uptrend line depicted in red on the chart. |

|
| Figure 1. Daily chart for MSFT 2022-2024. |
| Graphic provided by: StockCharts.com. |
| |
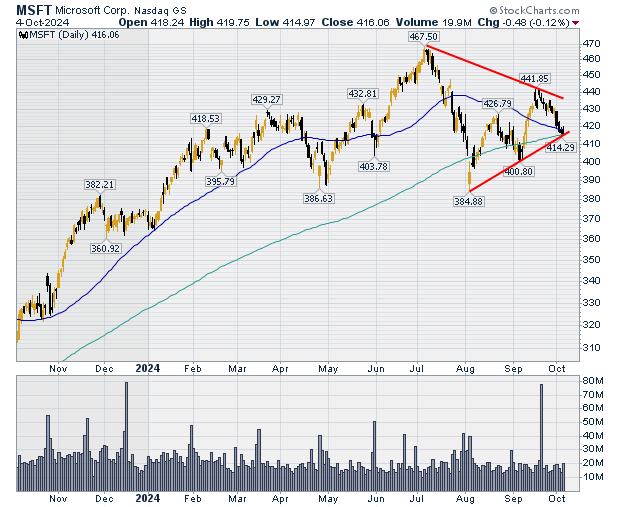
| In July 2024 MSFT reached its highs and proceeded to break through its uptrend line on the downside. Figure 2 shows price action in greater detail as price reacts from its July high and slices through the 200-day moving average. The first move back up towards the 50-day MA fails and price crosses below the 200-day MA again. The next time price attempts to rise higher, it successfully manages to break through both the 200-day and 50-day MAs. But then it immediately reacts again to the downside. At this point we can draw trendlines showing that MSFT has formed a symmetrical triangle price pattern (Figure 2). |

|
| Figure 2. Daily chart for MSFT 2024. |
| Graphic provided by: StockCharts.com. |
| |
| So where next for MSFT? We know that triangles are usually continuation patterns. This means that the direction of price out of the pattern should be the same as the direction of price entering the pattern. If this happens then MSFT will see more price action to the upside. But as we know, technical analysis is a study in probabilities not certainties. This is why we must wait for price to break through the pattern to confirm the direction of our trade. |
Stella Osoba is a trader and financial writer. She is a frequent contributor to "Technical Analysis of Stocks and Commodities" magazine and "Traders.com Advantage" as well as other financial publications.
| E-mail address: | stellaosoba@gmail.com |
Click here for more information about our publications!
Comments

|

Request Information From Our Sponsors
- StockCharts.com, Inc.
- Candle Patterns
- Candlestick Charting Explained
- Intermarket Technical Analysis
- John Murphy on Chart Analysis
- John Murphy's Chart Pattern Recognition
- John Murphy's Market Message
- MurphyExplainsMarketAnalysis-Intermarket Analysis
- MurphyExplainsMarketAnalysis-Visual Analysis
- StockCharts.com
- Technical Analysis of the Financial Markets
- The Visual Investor
- VectorVest, Inc.
- Executive Premier Workshop
- One-Day Options Course
- OptionsPro
- Retirement Income Workshop
- Sure-Fire Trading Systems (VectorVest, Inc.)
- Trading as a Business Workshop
- VectorVest 7 EOD
- VectorVest 7 RealTime/IntraDay
- VectorVest AutoTester
- VectorVest Educational Services
- VectorVest OnLine
- VectorVest Options Analyzer
- VectorVest ProGraphics v6.0
- VectorVest ProTrader 7
- VectorVest RealTime Derby Tool
- VectorVest Simulator
- VectorVest Variator
- VectorVest Watchdog
