

HOT TOPICS LIST
- MACD
- Fibonacci
- RSI
- Gann
- ADXR
- Stochastics
- Volume
- Triangles
- Futures
- Cycles
- Volatility
- ZIGZAG
- MESA
- Retracement
- Aroon
INDICATORS LIST
LIST OF TOPICS
PRINT THIS ARTICLE
by Stella Osoba, CMT
Ulta Beauty, Inc. (ULTA) is a large capitalization specialty retailer in the consumer discretionary sector. Its stock had been in a downtrend recently as earnings misses caused the market to punish the stock. But in a Q2 2024 13F filing, eagle-eyed market watchers noticed that Berkshire Hathaway had added shares of ULTA to their portfolio.
Position: N/A
Stella Osoba, CMT
Stella Osoba is a trader and financial writer. She is a frequent contributor to "Technical Analysis of Stocks and Commodities" magazine and "Traders.com Advantage" as well as other financial publications.
PRINT THIS ARTICLE
TECHNICAL ANALYSIS
Is It Time to Pay Attention to ULTA?
10/04/24 04:52:23 PMby Stella Osoba, CMT
Ulta Beauty, Inc. (ULTA) is a large capitalization specialty retailer in the consumer discretionary sector. Its stock had been in a downtrend recently as earnings misses caused the market to punish the stock. But in a Q2 2024 13F filing, eagle-eyed market watchers noticed that Berkshire Hathaway had added shares of ULTA to their portfolio.
Position: N/A
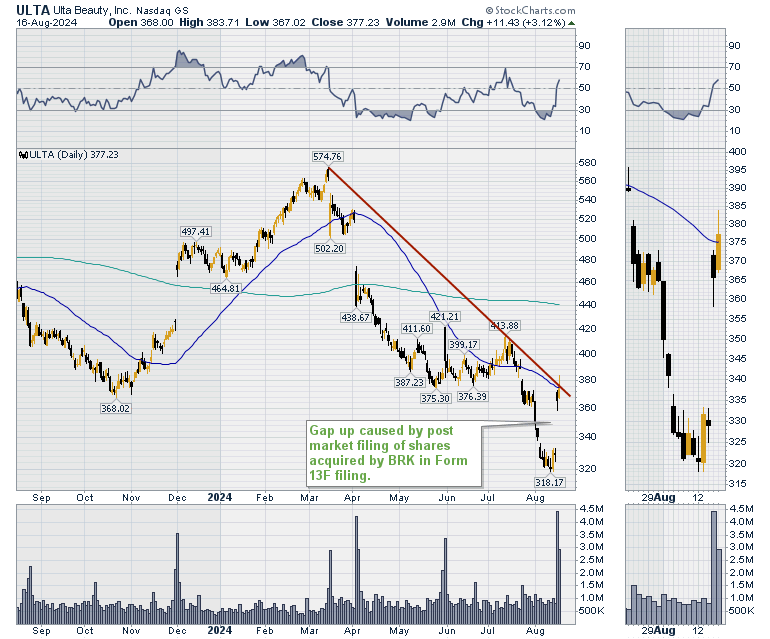
| Figure 1 is a daily chart of ULTA showing one year of price history. The chart shows ULTA's price peak on March 14, 2024 when it was trading at a high of $574.76. Price began to decline from that point. The red line shows the steady downtrend as price fell to a low of $318.17 on August 12, 2024. The stock price decline was partially caused by negative investor sentiment as a result of weak earnings and revenue guidance. |
|
| Figure 1. ULTA daily. |
| Graphic provided by: StockCharts.com. |
| |
| So, why did Warren Buffett's Berkshire Hathaway decided to swoop in and begin buying up shares; 690,106 at the last count? There are very likely to be sound fundamental reasons for this purchase. But we are technical analysts and so it is the chart that should tell us what there is to know about this stock. |
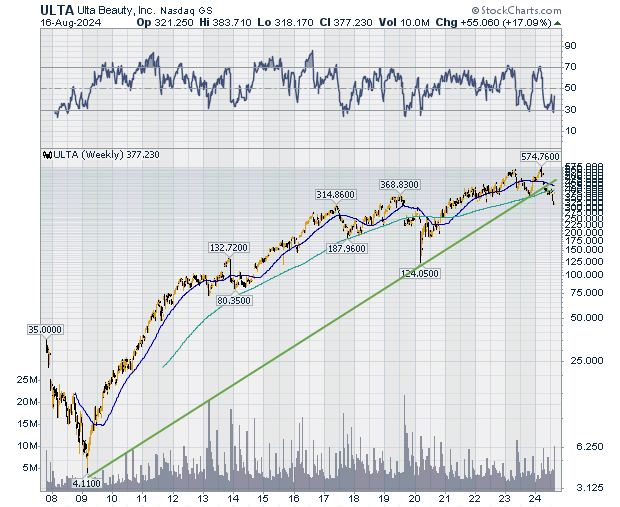
| ULTA began trading on the Nasdaq at $33 per share on October 25, 2007 (See Figure 2). This was perhaps not the most opportune time to list shares because in line with the broader market, shares collapsed during the 2008 financial crisis, bottoming at $4.11 on March 4, 2009. Bad news for the company, good news for the astute investor as shares subsequently rebounded and reached a high of $574.76 in March 2024; a 13,884% increase. |
|
| Figure 2. ULTA weekly. |
| Graphic provided by: StockCharts.com. |
| |
| The decline from the high in March 2024 to August 2024 was a 44.68% decrease. Figure 2 shows that this decrease broke the long term up trend line and also caused price to fall below the 200-day moving average on the weekly chart. On the daily chart (Figure 1) the price decline was significant enough to cause the long-term moving average to rise above the shorter-term moving average to form a death cross, which is a negative trading signal. |
| Price continued to plunge until news broke about the accumulation of shares by Berkshire Hathaway which resulted in a gap up on the trading day following the news on August 15, 2024 (see Figure 1). On August 16, there was follow through with price closing above the 50-day moving average and piercing the down trend line. So, does this mean the downtrend has reversed? Not necessarily. 690,106 is a lot of shares but represents only 1.44% of the total shares outstanding. For the trend to reverse, market sentiment has to grow, but we know it can also be fickle. So, while it is time to pay attention to ULTA, it may not be wise to jump in without more evidence. |
Stella Osoba is a trader and financial writer. She is a frequent contributor to "Technical Analysis of Stocks and Commodities" magazine and "Traders.com Advantage" as well as other financial publications.
| E-mail address: | stellaosoba@gmail.com |
Click here for more information about our publications!
PRINT THIS ARTICLE

Request Information From Our Sponsors
- StockCharts.com, Inc.
- Candle Patterns
- Candlestick Charting Explained
- Intermarket Technical Analysis
- John Murphy on Chart Analysis
- John Murphy's Chart Pattern Recognition
- John Murphy's Market Message
- MurphyExplainsMarketAnalysis-Intermarket Analysis
- MurphyExplainsMarketAnalysis-Visual Analysis
- StockCharts.com
- Technical Analysis of the Financial Markets
- The Visual Investor
- VectorVest, Inc.
- Executive Premier Workshop
- One-Day Options Course
- OptionsPro
- Retirement Income Workshop
- Sure-Fire Trading Systems (VectorVest, Inc.)
- Trading as a Business Workshop
- VectorVest 7 EOD
- VectorVest 7 RealTime/IntraDay
- VectorVest AutoTester
- VectorVest Educational Services
- VectorVest OnLine
- VectorVest Options Analyzer
- VectorVest ProGraphics v6.0
- VectorVest ProTrader 7
- VectorVest RealTime Derby Tool
- VectorVest Simulator
- VectorVest Variator
- VectorVest Watchdog