

HOT TOPICS LIST
- MACD
- Fibonacci
- RSI
- Gann
- ADXR
- Stochastics
- Volume
- Triangles
- Futures
- Cycles
- Volatility
- ZIGZAG
- MESA
- Retracement
- Aroon
INDICATORS LIST
LIST OF TOPICS
PRINT THIS ARTICLE
by Stella Osoba, CMT
Viridian Therapeutics, Inc. (VRDN) is a small cap biopharmaceutical company which engages in the development of proprietary RNA targeted therapeutics. Since its Initial Public Offering in June 2014, the company has reduced the number of its shares through two reverse stock splits. A reverse split affects the number of shares outstanding but not the market capitalization of the company.
Position: N/A
Stella Osoba, CMT
Stella Osoba is a trader and financial writer. She is a frequent contributor to "Technical Analysis of Stocks and Commodities" magazine and "Traders.com Advantage" as well as other financial publications.
PRINT THIS ARTICLE
TECHNICAL ANALYSIS
VRDN And Its Reverse Stock Splits
08/29/24 04:43:18 PMby Stella Osoba, CMT
Viridian Therapeutics, Inc. (VRDN) is a small cap biopharmaceutical company which engages in the development of proprietary RNA targeted therapeutics. Since its Initial Public Offering in June 2014, the company has reduced the number of its shares through two reverse stock splits. A reverse split affects the number of shares outstanding but not the market capitalization of the company.
Position: N/A
| On November 16, 2016, VRDN issued a 1:15 reverse stock split. This meant that for every 15 shares an investor held, after the stock split went into effect, the investor would hold one. On November 13, 2020, VRDN initiated another 1:15 stock split further reducing any shares investors held. |
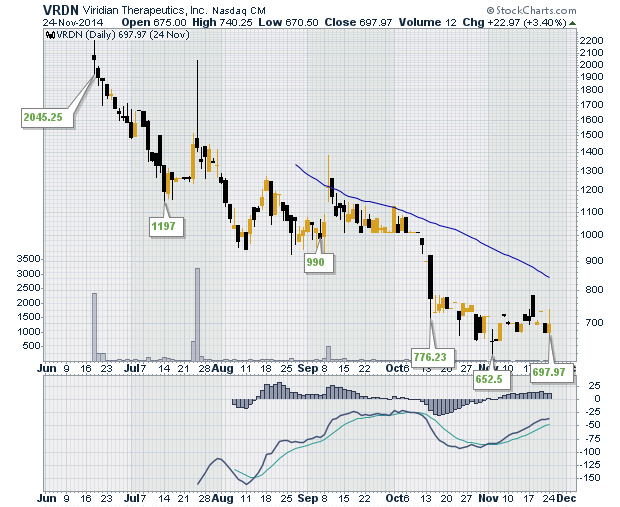
| On the first day of trading which was June 18, 2014, the stock opened at a price of $2,081.25 per share. Shares closed at $2,045.25 (See Figure 1). Figure 1 is a daily chart of VRDN showing price action from the date of its initial IPO until November 2014. We can see the decline in effect as the year drew to a close. |
|
| Figure 1. One year daily chart for VRDN. |
| Graphic provided by: StockCharts.com. |
| |
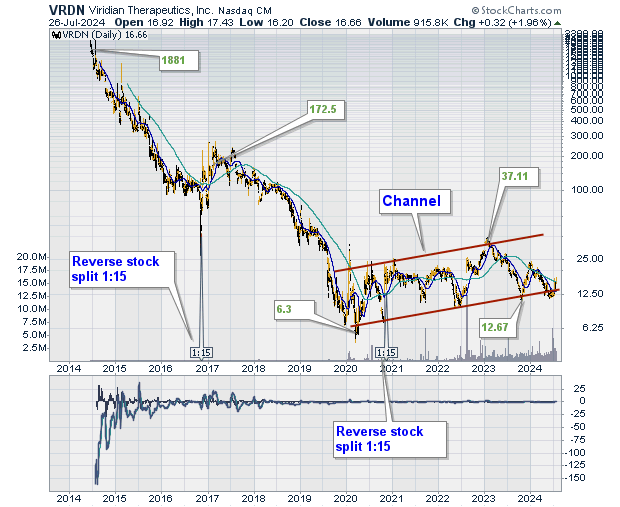
| Figure 2 is a daily chart of VRDN showing its entire price action from its initial IPO in June of 2014. VRDN's share price continued to decline through 2015. In 2016, though the share price had not increased, it seems it had found some support as it traded sideways. A reverse stock split is done for various reasons, but the market usually perceives it negatively. We can see annotated on the chart (Figure 2), the reverse stock split in 2016 and the second in 2020. In neither case did the stock split improve the share price. |
|
| Figure 2. Ten year daily chart for VRDN with trend channel. |
| Graphic provided by: StockCharts.com. |
| |
| After the first stock split, VRDN began a long descent to a low of below $6 in March of 2020. From that low, VRDN began trading in what was to be a multi-year channel (See Figure 2). The channel formed from 2020 to the present and price is yet to break out of it. During the time spent in the channel, VRDN underwent another 1:15 reverse stock split as we can see on the chart. Once again, this stock split did not do much to improve the price of the stock. |
| Recently, there has been some positive new surrounding the stock, with Goldman Sachs bullish on it. I have yet to see positive technical price action. At the very least, VRDN would have to break out of its upward sloping channel to the upside. |
Stella Osoba is a trader and financial writer. She is a frequent contributor to "Technical Analysis of Stocks and Commodities" magazine and "Traders.com Advantage" as well as other financial publications.
| E-mail address: | stellaosoba@gmail.com |
Click here for more information about our publications!
PRINT THIS ARTICLE

Request Information From Our Sponsors
- StockCharts.com, Inc.
- Candle Patterns
- Candlestick Charting Explained
- Intermarket Technical Analysis
- John Murphy on Chart Analysis
- John Murphy's Chart Pattern Recognition
- John Murphy's Market Message
- MurphyExplainsMarketAnalysis-Intermarket Analysis
- MurphyExplainsMarketAnalysis-Visual Analysis
- StockCharts.com
- Technical Analysis of the Financial Markets
- The Visual Investor
- VectorVest, Inc.
- Executive Premier Workshop
- One-Day Options Course
- OptionsPro
- Retirement Income Workshop
- Sure-Fire Trading Systems (VectorVest, Inc.)
- Trading as a Business Workshop
- VectorVest 7 EOD
- VectorVest 7 RealTime/IntraDay
- VectorVest AutoTester
- VectorVest Educational Services
- VectorVest OnLine
- VectorVest Options Analyzer
- VectorVest ProGraphics v6.0
- VectorVest ProTrader 7
- VectorVest RealTime Derby Tool
- VectorVest Simulator
- VectorVest Variator
- VectorVest Watchdog