

HOT TOPICS LIST
- MACD
- Fibonacci
- RSI
- Gann
- ADXR
- Stochastics
- Volume
- Triangles
- Futures
- Cycles
- Volatility
- ZIGZAG
- MESA
- Retracement
- Aroon
INDICATORS LIST
LIST OF TOPICS
PRINT THIS ARTICLE
by Stella Osoba, CMT
With the consensus building that the Fed will begin cutting the Federal Funds Rate in September 2024, there is hope that this will invigorate the housing market as reluctant sellers enter the market and priced out buyers see more housing inventory possibly causing some downward pressure on current sky-high house prices.
Position: N/A
Stella Osoba, CMT
Stella Osoba is a trader and financial writer. She is a frequent contributor to "Technical Analysis of Stocks and Commodities" magazine and "Traders.com Advantage" as well as other financial publications.
PRINT THIS ARTICLE
TECHNICAL ANALYSIS
Zillow
08/29/24 04:39:37 PMby Stella Osoba, CMT
With the consensus building that the Fed will begin cutting the Federal Funds Rate in September 2024, there is hope that this will invigorate the housing market as reluctant sellers enter the market and priced out buyers see more housing inventory possibly causing some downward pressure on current sky-high house prices.
Position: N/A
| Zillow Group, Inc. (Z) was founded in 2006 and became a public company in 2011. It is a technological real estate marketplace in the real estate sector. The company allows buyers, sellers, renters and others interested in real estate to search for, list and access data on properties. |
|
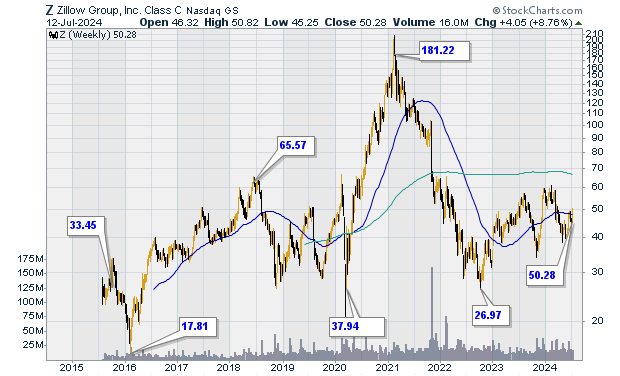
| Figure 1. Weekly chart for Zillow (Z). |
| Graphic provided by: StockCharts.com. |
| |
| Figure 1 is a weekly price chart of trading action for Z since 2011. We can see that it has had wild price swings in the past, with price trading as low as $15.36 in February 2016. Its all-time high was seen in February 2021 when price traded as high as $202.65. It closed that day at $197.81. |
| The highs of February 2021 formed a V-shaped reversal and price subsequently began a steep descent which did not end until June 2022 when price formed what was to be the first V of a W shaped reversal, reaching a low of $28.61. The second V of the W shaped reversal happened in October of that year. Price then marked an even lower low of $27.81. It then reversed to the upside, ending the downtrend. |
|
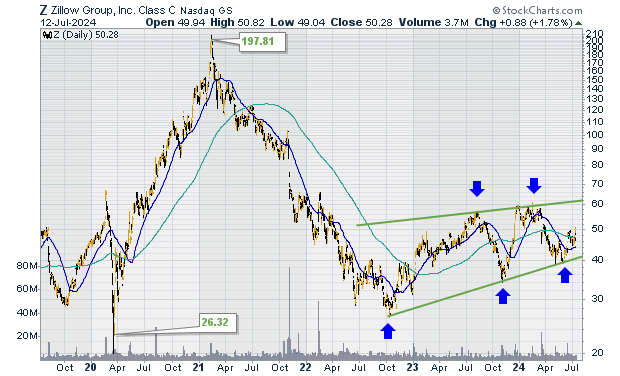
| Figure 2. Daily chart for Zillow (Z). |
| Graphic provided by: StockCharts.com. |
| |
| Figure 2 is a daily chart of Z. We can see the swing highs and lows. From the lows in October 2022, price has recovered to trade in an upward slanting channel. Blue arrows on the chart mark the swing highs and lows as price continues to trade within the channel. At the moment, it is impossible to say whether price will break out to the upside or downside. So, patience in placing trades in the direction of the eventual breakout is useful. |
Stella Osoba is a trader and financial writer. She is a frequent contributor to "Technical Analysis of Stocks and Commodities" magazine and "Traders.com Advantage" as well as other financial publications.
| E-mail address: | stellaosoba@gmail.com |
Click here for more information about our publications!
PRINT THIS ARTICLE

Request Information From Our Sponsors
- VectorVest, Inc.
- Executive Premier Workshop
- One-Day Options Course
- OptionsPro
- Retirement Income Workshop
- Sure-Fire Trading Systems (VectorVest, Inc.)
- Trading as a Business Workshop
- VectorVest 7 EOD
- VectorVest 7 RealTime/IntraDay
- VectorVest AutoTester
- VectorVest Educational Services
- VectorVest OnLine
- VectorVest Options Analyzer
- VectorVest ProGraphics v6.0
- VectorVest ProTrader 7
- VectorVest RealTime Derby Tool
- VectorVest Simulator
- VectorVest Variator
- VectorVest Watchdog
- StockCharts.com, Inc.
- Candle Patterns
- Candlestick Charting Explained
- Intermarket Technical Analysis
- John Murphy on Chart Analysis
- John Murphy's Chart Pattern Recognition
- John Murphy's Market Message
- MurphyExplainsMarketAnalysis-Intermarket Analysis
- MurphyExplainsMarketAnalysis-Visual Analysis
- StockCharts.com
- Technical Analysis of the Financial Markets
- The Visual Investor