

HOT TOPICS LIST
- MACD
- Fibonacci
- RSI
- Gann
- ADXR
- Stochastics
- Volume
- Triangles
- Futures
- Cycles
- Volatility
- ZIGZAG
- MESA
- Retracement
- Aroon
INDICATORS LIST
LIST OF TOPICS
PRINT THIS ARTICLE
by Stella Osoba, CMT
Peloton (PTON) has not had along history as a public company. Its IPO was on September 26, 2019 when the shares were priced at $29 per share. Since then, its share price has seen substantial gains buoyed by Covid lockdowns and significant declines. Without the benefit of hindsight, good technical analysis skills and the appropriate level of risk taking and risk management would have made this a very successful short trade.
Position: N/A
Stella Osoba, CMT
Stella Osoba is a trader and financial writer. She is a frequent contributor to "Technical Analysis of Stocks and Commodities" magazine and "Traders.com Advantage" as well as other financial publications.
PRINT THIS ARTICLE
TECHNICAL ANALYSIS
Managing the Short Trade
07/12/24 05:17:19 PMby Stella Osoba, CMT
Peloton (PTON) has not had along history as a public company. Its IPO was on September 26, 2019 when the shares were priced at $29 per share. Since then, its share price has seen substantial gains buoyed by Covid lockdowns and significant declines. Without the benefit of hindsight, good technical analysis skills and the appropriate level of risk taking and risk management would have made this a very successful short trade.
Position: N/A
| Figure 1 is a daily chart of PTON showing its price action from the day of its IPO until the present. As we can see from the chart, price completed the formation of a double bottom in March 2020 and then began an impressive run up. This run up ended on January 14, 2021, when price reached a high of $171.09, but closed at $165.25. With all the euphoria surrounding the stock at the time, it would have been difficult to find copy from financial writers warning of what was to come. The expectation would have been for continued price increases and to therefore go long on pull backs. But financial writers are not usually traders so why go to them for trading advice? Much better to rely on tools designed for the interpretation of price action and the skill of learned risk taking and risk management. |

|
| Figure 1. Daily chart for PTON. |
| Graphic provided by: StockCharts.com. |
| |
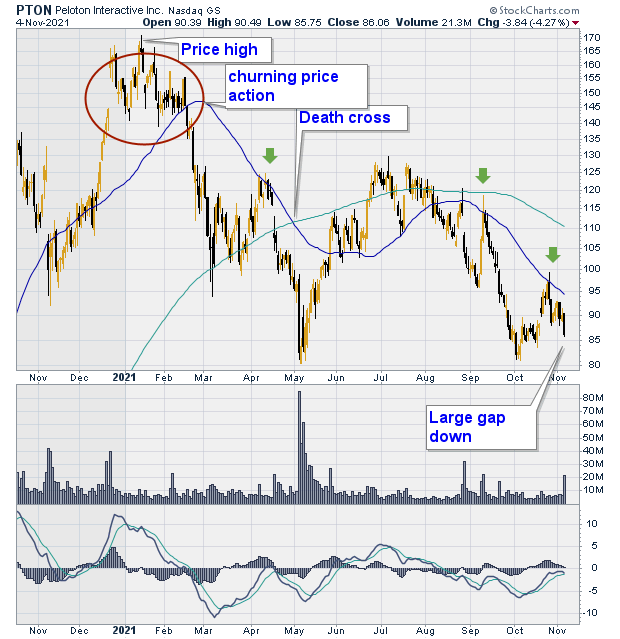
| Figure 2 is a daily price chart of the period when the stock was beginning its churn to the down side. Interpreting this price action and knowing what to be on the look out for is how successful trades can be had. After a quick run-up in price, the churn began by sending price back to the 50-day moving average (See red circle on chart). Even though price plunged through the 50-day moving average, this would not have been a good time to take the risk on a short trade without more information. We can see that after the plunge price recovered and moved back up to the 50-day MA. But price made an unsuccessful attempt to push through it (Green arrow on chart). AS price fell below the moving average once more, the signal for a short trade was the first breach of the MA on the downside. Confirmation was the unsuccessful attempt to rise above the MA. |
|
| Figure 2. Multiple trade opportunities before a large gap down in late 2021. |
| Graphic provided by: StockCharts.com. |
| |
| Trading does not require you to sell at the high and buy at the lows. Many successful traders are content simply to participate in a part of the trend. In this case if we had missed the initial entry point, it would have been worth it to wait for another entry. After the unsuccessful test of the MA, the 50-day and 200-day MAs formed a death cross. This is when the shorter moving average crosses below the longer moving average and is a well-known bearish signal. |
| Two further entry points are marked on the chart by green arrows. After the last day depicted on the chart in Figure2 which was November 4, 2021, there was a large gap down. Over the last two and a half years, price has continued to decline reaching a low of $2.70 on May 2, 2024. The signal to exit the short trade could have been on a cross of the 50-day MA above the 200-day MA, any new lows or pre-entry price targets often calculated from Point & Figure charts (Not shown here). It is important to remember that in cases like these there is no need to panic in or out of a trade. Having the correct risk taking and risk management skills will allow you to wait for entry signals and confirmation before entry. The correct approach will also allow you to remain in the trade for as long as the trade allows you to. |
Stella Osoba is a trader and financial writer. She is a frequent contributor to "Technical Analysis of Stocks and Commodities" magazine and "Traders.com Advantage" as well as other financial publications.
| E-mail address: | stellaosoba@gmail.com |
Click here for more information about our publications!
Comments
Date:�08/16/24Rank:�5Comment:�Great article, appreciate your thorough analysis. Thank you!

Request Information From Our Sponsors
- StockCharts.com, Inc.
- Candle Patterns
- Candlestick Charting Explained
- Intermarket Technical Analysis
- John Murphy on Chart Analysis
- John Murphy's Chart Pattern Recognition
- John Murphy's Market Message
- MurphyExplainsMarketAnalysis-Intermarket Analysis
- MurphyExplainsMarketAnalysis-Visual Analysis
- StockCharts.com
- Technical Analysis of the Financial Markets
- The Visual Investor
- VectorVest, Inc.
- Executive Premier Workshop
- One-Day Options Course
- OptionsPro
- Retirement Income Workshop
- Sure-Fire Trading Systems (VectorVest, Inc.)
- Trading as a Business Workshop
- VectorVest 7 EOD
- VectorVest 7 RealTime/IntraDay
- VectorVest AutoTester
- VectorVest Educational Services
- VectorVest OnLine
- VectorVest Options Analyzer
- VectorVest ProGraphics v6.0
- VectorVest ProTrader 7
- VectorVest RealTime Derby Tool
- VectorVest Simulator
- VectorVest Variator
- VectorVest Watchdog