HOT TOPICS LIST
- MACD
- Fibonacci
- RSI
- Gann
- ADXR
- Stochastics
- Volume
- Triangles
- Futures
- Cycles
- Volatility
- ZIGZAG
- MESA
- Retracement
- Aroon
INDICATORS LIST
LIST OF TOPICS
PRINT THIS ARTICLE
by Stella Osoba, CMT
On Friday, August 25, 2022, the Dow Jones Industrial Average (INDU) dropped a whopping 1000 points. This was a direct reaction to Jeremy Powell, the Chairman of the Federal Reserve's hawkish stance on interest rates.
Position: N/A
Stella Osoba, CMT
Stella Osoba is a trader and financial writer. She is a frequent contributor to "Technical Analysis of Stocks and Commodities" magazine and "Traders.com Advantage" as well as other financial publications.
PRINT THIS ARTICLE
TECHNICAL ANALYSIS
Market Volatility and the INDU
10/06/22 04:09:17 PMby Stella Osoba, CMT
On Friday, August 25, 2022, the Dow Jones Industrial Average (INDU) dropped a whopping 1000 points. This was a direct reaction to Jeremy Powell, the Chairman of the Federal Reserve's hawkish stance on interest rates.
Position: N/A
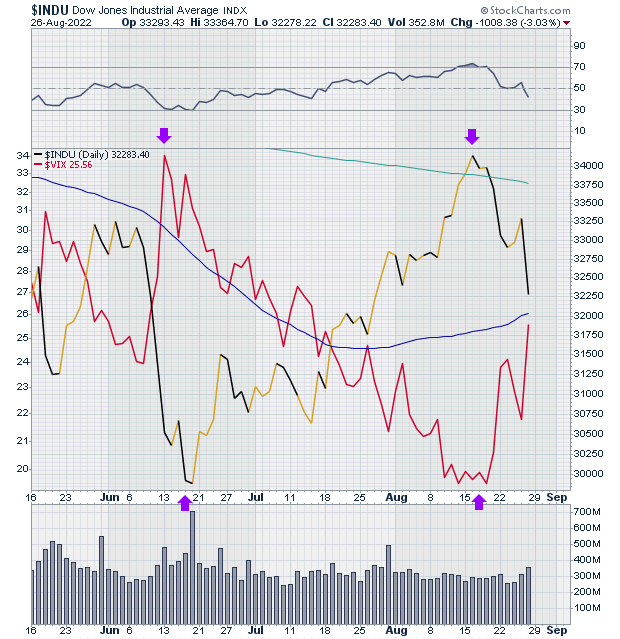
| With such a large drop in the INDU, now would be a good time for a brief recap on the CBOE Volatility Index (VIX). The VIX, also known as the Fear Gauge is a calculation of a selection of option prices trading on the S&P 500 with maturities between 23 and 37 days. The VIX is designed to measure the level of bullish as opposed to bearish sentiment in the market. On August 25, 2022, the VIX jumped to close at 25.25 and the INDU plunged 1008 points. In the last 52 weeks the VIX's low was 14.73 and its high was 38.94. |
| The VIX has an inverse relationship with the INDU. When markets are falling, the VIX will usually be rising, indicating the rising level of expected market volatility and hence uncertainty. When the markets are rising, the VIX index will usually fall, suggesting more certainty or complacency in the market. |

|
| |
| Figure 1 is a daily chart showing the VIX (red line) and the INDU (black line). The inverse relationship between the two is clear with the purple arrows showing peaks in the VIX corresponding to lows in the INDU and lows in the INDU corresponds to peaks in the VIX. On June 13, 2022, when the INDU fell to 30,516, the VIX rose to its highest level in the last four months to close at 34. However, when the INDU rose to close at 34,152 on August 16, 2022, the VIX correspondingly fell to a low of 19.69. |
| In periods of extreme volatility such as the one we are now in it is important to remember that periods of "high volatility begats low volatility". Which just means that over time markets are expected to return to their mean. Apart from the experienced short-term trader who trades volatility, it is often unwise for the retail trader to react to these sudden sharp market jolts caused by under anticipated news. There may well be more pain in store as the market adjusts to a higher interest rate environment. But remember that markets are forward looking which means that the repricing of asset prices going on now is factoring in foreseeable future conditions. Trading on the news as it comes out means that you are trading on factors that have already been priced into stock prices. This is often why people find themselves selling at the low, just as prices are about to reverse. |
| Volatility can be scary, but it can also be an opportunity, especially when companies with strong balance sheets and solid earnings are trading in bear market territory. Riding a bear market, may not be the worst investment strategy. But remember, this is not investment advice. This content, as usual, is for educational purposes only. |
Stella Osoba is a trader and financial writer. She is a frequent contributor to "Technical Analysis of Stocks and Commodities" magazine and "Traders.com Advantage" as well as other financial publications.
| E-mail address: | stellaosoba@gmail.com |
Click here for more information about our publications!
Comments

Request Information From Our Sponsors
- StockCharts.com, Inc.
- Candle Patterns
- Candlestick Charting Explained
- Intermarket Technical Analysis
- John Murphy on Chart Analysis
- John Murphy's Chart Pattern Recognition
- John Murphy's Market Message
- MurphyExplainsMarketAnalysis-Intermarket Analysis
- MurphyExplainsMarketAnalysis-Visual Analysis
- StockCharts.com
- Technical Analysis of the Financial Markets
- The Visual Investor
- VectorVest, Inc.
- Executive Premier Workshop
- One-Day Options Course
- OptionsPro
- Retirement Income Workshop
- Sure-Fire Trading Systems (VectorVest, Inc.)
- Trading as a Business Workshop
- VectorVest 7 EOD
- VectorVest 7 RealTime/IntraDay
- VectorVest AutoTester
- VectorVest Educational Services
- VectorVest OnLine
- VectorVest Options Analyzer
- VectorVest ProGraphics v6.0
- VectorVest ProTrader 7
- VectorVest RealTime Derby Tool
- VectorVest Simulator
- VectorVest Variator
- VectorVest Watchdog
