

HOT TOPICS LIST
- MACD
- Fibonacci
- RSI
- Gann
- ADXR
- Stochastics
- Volume
- Triangles
- Futures
- Cycles
- Volatility
- ZIGZAG
- MESA
- Retracement
- Aroon
INDICATORS LIST
LIST OF TOPICS
PRINT THIS ARTICLE
by Stella Osoba, CMT
When the news is bad... when nobody loves the stock. But maybe the shrewd investor should keep a watchful eye on the technicals and ignore everything else.
Position: N/A
Stella Osoba, CMT
Stella Osoba is a trader and financial writer. She is a frequent contributor to "Technical Analysis of Stocks and Commodities" magazine and "Traders.com Advantage" as well as other financial publications.
PRINT THIS ARTICLE
TECHNICAL ANALYSIS
Rivian Automotive, Inc.
10/06/22 04:00:22 PMby Stella Osoba, CMT
When the news is bad... when nobody loves the stock. But maybe the shrewd investor should keep a watchful eye on the technicals and ignore everything else.
Position: N/A
| Rivian Automotive, Inc. (RIVN) is a manufacturer of electric vehicles. The company's IPO was on November 10,2021 and its shares were priced at $78. As I write this piece on August 15, 2022, the stock is trading at around $38. A long way down from $78, but up off its lows. What story do the charts tell? |
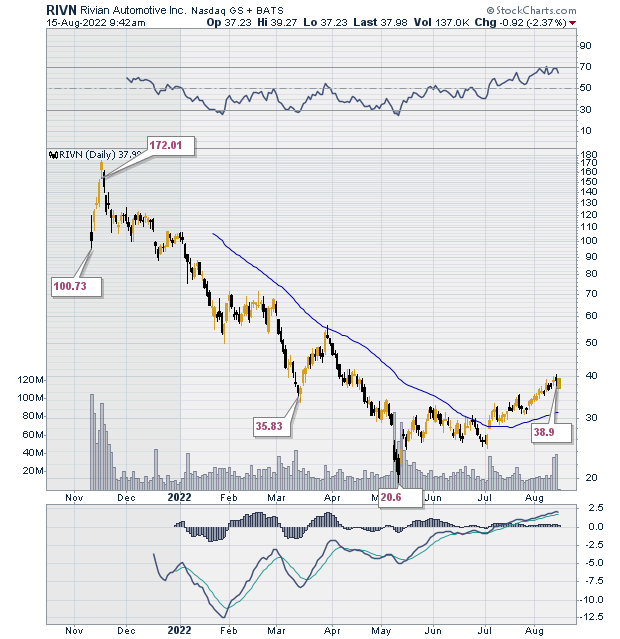
| Figure 1 shows a daily chart of RIVN. On November 10, 2021, RIVN's first day of trading, the stock closed at $100.73. It had traded as high as $119.46 on that day. The stock continued to trade higher over the next few days reaching a high of $179.47 on November 16, 2021 (Note that Figure 1 shows only closing prices in the text boxes). |

|
| Figure 1. Daily chart for RIVN. |
| Graphic provided by: StockCharts.com. |
| |
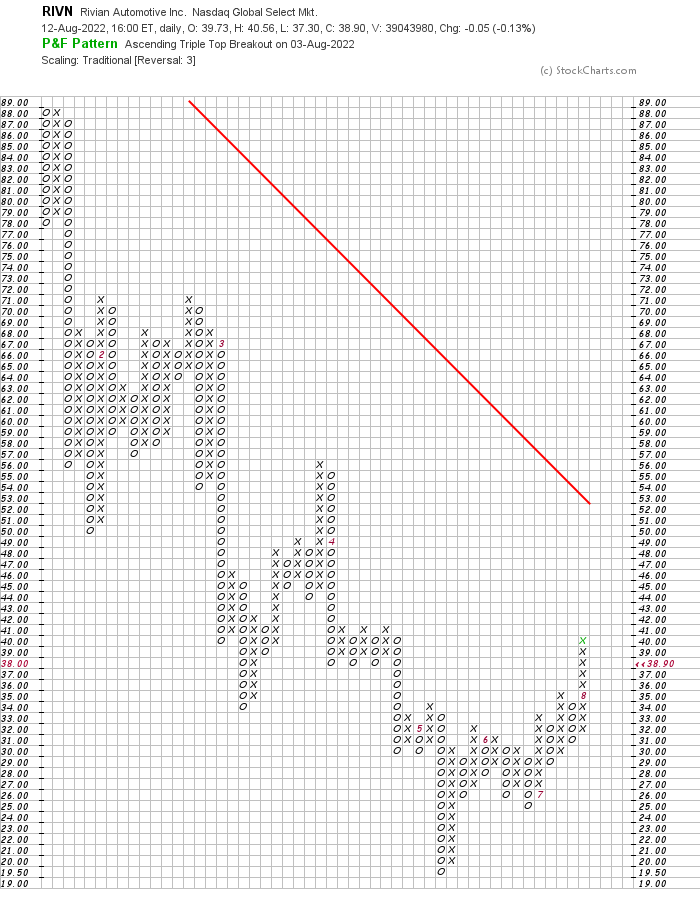
| After November 16, 2021, the stock began a long painful descent. On May 11, 2022, RIVN traded for a low of $19.25. Its closing price on that day was $20.60. This is where price diverges from fundamentals. The news surrounding RIVN is bleak. The company has lost more than $2billion on an operating basis, it has fallen short of its IPO targets, there is an expectation that the company might need another capital raise sometime soon. And yet the technicals are telling us a different story as regards the anticipated price performance of this stock. Figure Two is a point and figure chart showing that RIVN completed a triple top breakout on August 3,2022 which is bearish. Since its price low, price has risen to $38. |
|
| Figure 2. P&F chart for RIVN. |
| Graphic provided by: StockCharts.com. |
| |
| The next chart to pay attention to is the daily price chart showing RIVN's down trend line break (Figure Three). We can also see that the 50-day moving average is beginning to turn up (Remember that a moving average is a lagging indicator). Also, clearly indicated on the chart is the positive divergence that price has formed with the Moving Average Convergence/Divergence (MACD). With all these positives, is the stock currently a buy? |
|
| Figure 3. Daily chart with 50-day MA and MACD turning positive. |
| Graphic provided by: StockCharts.com. |
| |
| That is a question I cannot answer. Anyone who reads my articles with any regularity will know that I never give opinions on what to buy and when to buy. The best I can do is to show how to perform the analysis. The decision to buy or not to buy is left to the reader who is cautioned to perform rigorous research before deciding either way. |
Stella Osoba is a trader and financial writer. She is a frequent contributor to "Technical Analysis of Stocks and Commodities" magazine and "Traders.com Advantage" as well as other financial publications.
| E-mail address: | stellaosoba@gmail.com |
Click here for more information about our publications!
Comments

Request Information From Our Sponsors
- StockCharts.com, Inc.
- Candle Patterns
- Candlestick Charting Explained
- Intermarket Technical Analysis
- John Murphy on Chart Analysis
- John Murphy's Chart Pattern Recognition
- John Murphy's Market Message
- MurphyExplainsMarketAnalysis-Intermarket Analysis
- MurphyExplainsMarketAnalysis-Visual Analysis
- StockCharts.com
- Technical Analysis of the Financial Markets
- The Visual Investor
- VectorVest, Inc.
- Executive Premier Workshop
- One-Day Options Course
- OptionsPro
- Retirement Income Workshop
- Sure-Fire Trading Systems (VectorVest, Inc.)
- Trading as a Business Workshop
- VectorVest 7 EOD
- VectorVest 7 RealTime/IntraDay
- VectorVest AutoTester
- VectorVest Educational Services
- VectorVest OnLine
- VectorVest Options Analyzer
- VectorVest ProGraphics v6.0
- VectorVest ProTrader 7
- VectorVest RealTime Derby Tool
- VectorVest Simulator
- VectorVest Variator
- VectorVest Watchdog