

HOT TOPICS LIST
- MACD
- Fibonacci
- RSI
- Gann
- ADXR
- Stochastics
- Volume
- Triangles
- Futures
- Cycles
- Volatility
- ZIGZAG
- MESA
- Retracement
- Aroon
INDICATORS LIST
LIST OF TOPICS
PRINT THIS ARTICLE
by Stella Osoba, CMT
LMP Automotive Holdings, Inc (LMPX) is a small capitalization stock in the consumer discretionary sector. Its chart appears to deserve a second look.
Position: N/A
Stella Osoba, CMT
Stella Osoba is a trader and financial writer. She is a frequent contributor to "Technical Analysis of Stocks and Commodities" magazine and "Traders.com Advantage" as well as other financial publications.
PRINT THIS ARTICLE
TECHNICAL ANALYSIS
LMP Automotive Holdings, Inc.
08/12/22 03:29:57 PMby Stella Osoba, CMT
LMP Automotive Holdings, Inc (LMPX) is a small capitalization stock in the consumer discretionary sector. Its chart appears to deserve a second look.
Position: N/A
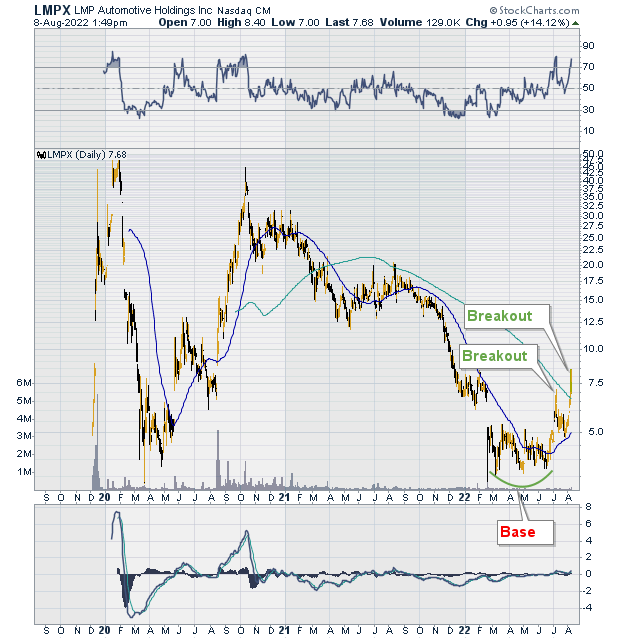
| The basics of bases is that after a downtrend, wait for a price chart to show the formation of a base. This base could last for a few weeks to several months. But the base should be clearly seen on the price chart. Usually, the longer the time that price is in the base the more substantial the breakout. A base could be formed on a price chart in any time frame. I will usually look for bases on daily or weekly charts. |
| LMPX operates an e-commerce platform in which consumers can buy, sell and finance new or pre-owned vehicles. It was founded in 2017 and in 2019 it went public. Its shares are listed on the Nasdaq. From a low of $4.90 on December 5, 2019, shares rocketed to a high of $49.30 on January 30, 2020. On March 3, 2020, shares had fallen below its previous low to $3.33 on March 20, 2020. From here, shares rose to touch a lower high of $45.00 on October 11, 2020. Then price began a long painful descent to test its prior price lows (See Figure 1). |
|
| Figure One |
| Graphic provided by: StockCharts.com. |
| |
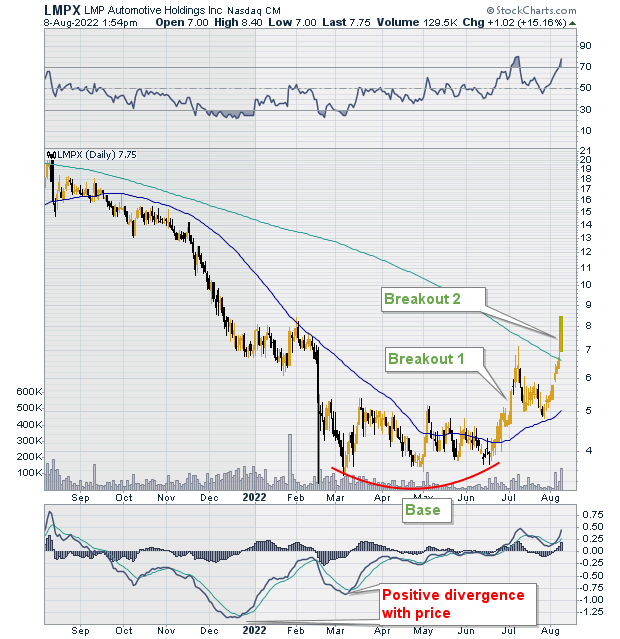
| On February 16, 2022, price returned to test the low of $3.35. From here price began to form a base. Over the next five months, multiple price dips did not take price back down to its earlier low (See Figure 2). The first breakout happened when price moved up above the 50-day moving average, closing the prior down gap. Price turned down and found support at the 50-day moving average. From here price began to climb and marked a second price breakout. (Note: a breakout happens when price rises higher than the previous high on heavy volume. Volume should be at least double that of the prior day). The second breakout took price up above the 200-day moving average. Even though the 200-day moving average is above the 50-day moving average which is bearish, we can see from the chart that the 50-day moving average has begun to turn up (Moving averages are a lagging indicator). |
|
| Figure Two |
| Graphic provided by: StockCharts.com. |
| |
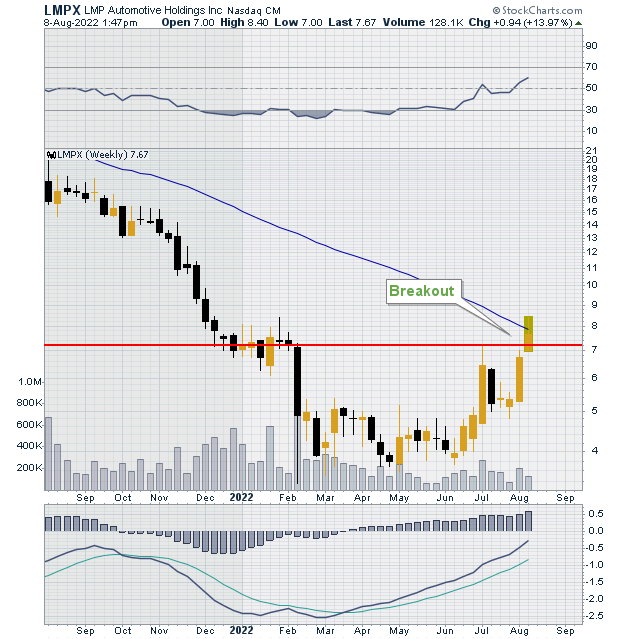
| Figure 3 is a weekly chart of LMPX. We can clearly see that even in this time frame, there is the beginnings of a breakout. Since this article was generated on a Monday and it was during the trading day, there is still plenty of time for the signal to reverse or strengthen. |
|
| Figure Three |
| Graphic provided by: StockCharts.com. |
| |
| Technical analysis is valuable because it can highlight useful trading signals. But all signals are to be viewed with suspicion until confirmation. Note: This article is for educational purposes only. |
Stella Osoba is a trader and financial writer. She is a frequent contributor to "Technical Analysis of Stocks and Commodities" magazine and "Traders.com Advantage" as well as other financial publications.
| E-mail address: | stellaosoba@gmail.com |
Click here for more information about our publications!
PRINT THIS ARTICLE

Request Information From Our Sponsors
- VectorVest, Inc.
- Executive Premier Workshop
- One-Day Options Course
- OptionsPro
- Retirement Income Workshop
- Sure-Fire Trading Systems (VectorVest, Inc.)
- Trading as a Business Workshop
- VectorVest 7 EOD
- VectorVest 7 RealTime/IntraDay
- VectorVest AutoTester
- VectorVest Educational Services
- VectorVest OnLine
- VectorVest Options Analyzer
- VectorVest ProGraphics v6.0
- VectorVest ProTrader 7
- VectorVest RealTime Derby Tool
- VectorVest Simulator
- VectorVest Variator
- VectorVest Watchdog
- StockCharts.com, Inc.
- Candle Patterns
- Candlestick Charting Explained
- Intermarket Technical Analysis
- John Murphy on Chart Analysis
- John Murphy's Chart Pattern Recognition
- John Murphy's Market Message
- MurphyExplainsMarketAnalysis-Intermarket Analysis
- MurphyExplainsMarketAnalysis-Visual Analysis
- StockCharts.com
- Technical Analysis of the Financial Markets
- The Visual Investor