HOT TOPICS LIST
- MACD
- Fibonacci
- RSI
- Gann
- ADXR
- Stochastics
- Volume
- Triangles
- Futures
- Cycles
- Volatility
- ZIGZAG
- MESA
- Retracement
- Aroon
INDICATORS LIST
LIST OF TOPICS
PRINT THIS ARTICLE
by Matt Blackman
It's been a tough year so far, but a number of factors are lining up to say there's a light at the end of the tunnel.
Position: N/A
Matt Blackman
Matt Blackman is a full-time technical and financial writer and trader. He produces corporate and financial newsletters, and assists clients in getting published in the mainstream media. Matt has earned the Chartered Market Technician (CMT) designation. Follow Matt on Twitter at www.twitter.com/RatioTrade
PRINT THIS ARTICLE
Promising Signs That Stocks Have Put In A Major Bottom
08/11/22 04:14:29 PMby Matt Blackman
It's been a tough year so far, but a number of factors are lining up to say there's a light at the end of the tunnel.
Position: N/A
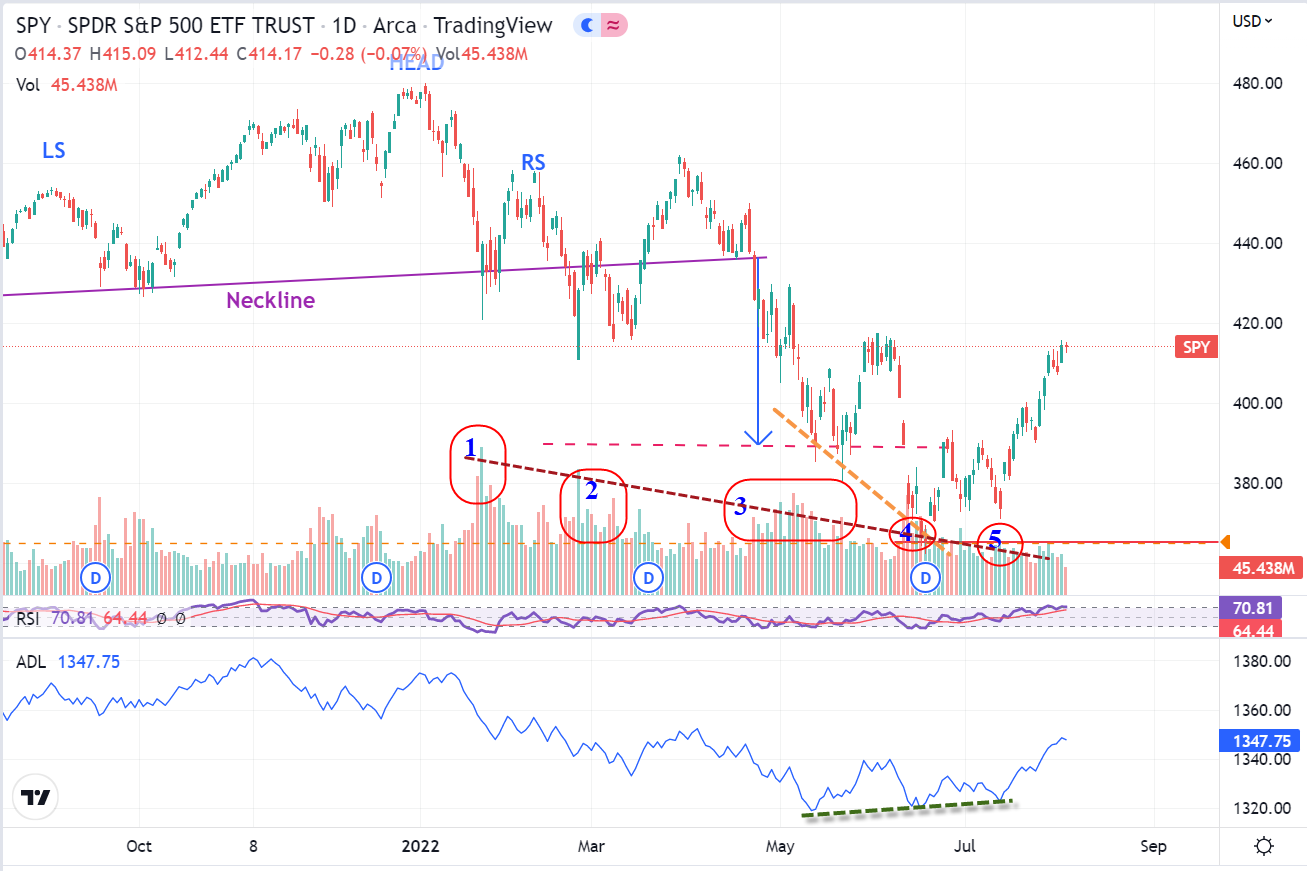
| Long before I began studying technical analysis on the road to earning the Chartered Market Technician (CMT) designation, I followed futures trader Larry Williams. Larry takes a practical approach to trading and has developed many effective trading indicators and strategies, entering trades when his indicators line up and exiting as quickly if the trade goes against him. As summer 2022 hit mid stride, Williams produced a fascinating video titled "Get Ready - Markets are Ready to Rock & Roll" in which he makes a powerful case to support his contention that a major rally is underway. Three reasons why markets look to have bottomed, (at least for the time being): 1) We have seen major capitulation in stocks - Capitulation is said to occur when sellers have sold most of their positions so that buyers account for most volume. A major bullish technical signal occurs when we witness panic selling, followed by a rally then another round of selling etc. The key point is that with each peak in panic selling (stock low), selling volume falls at each lower low. This indicates that selling pressure is weakening and buying pressure is picking up (See Figure 1). 2) Major buying is entering the market showing positive divergence between Market Breadth (A/D line) and the SPY (See Figure 1). 3) Cycles are turning bullish. One of the most powerful stock market cycles is the Election or Presidential Cycle. |

|
| Figure 1. Daily SPY ETF chart showing market capitulation (see red ovals 1 through 5) showing declining volume with each low showing – number 1 shows high selling which diminished with each selling peak (stock low). Note also the positive divergence between the Advance/Decline or Market Breadth line and SPY lows (see orange vs green dashed lines) which shows buying pressure building. |
| Graphic provided by: TradingView. |
| |
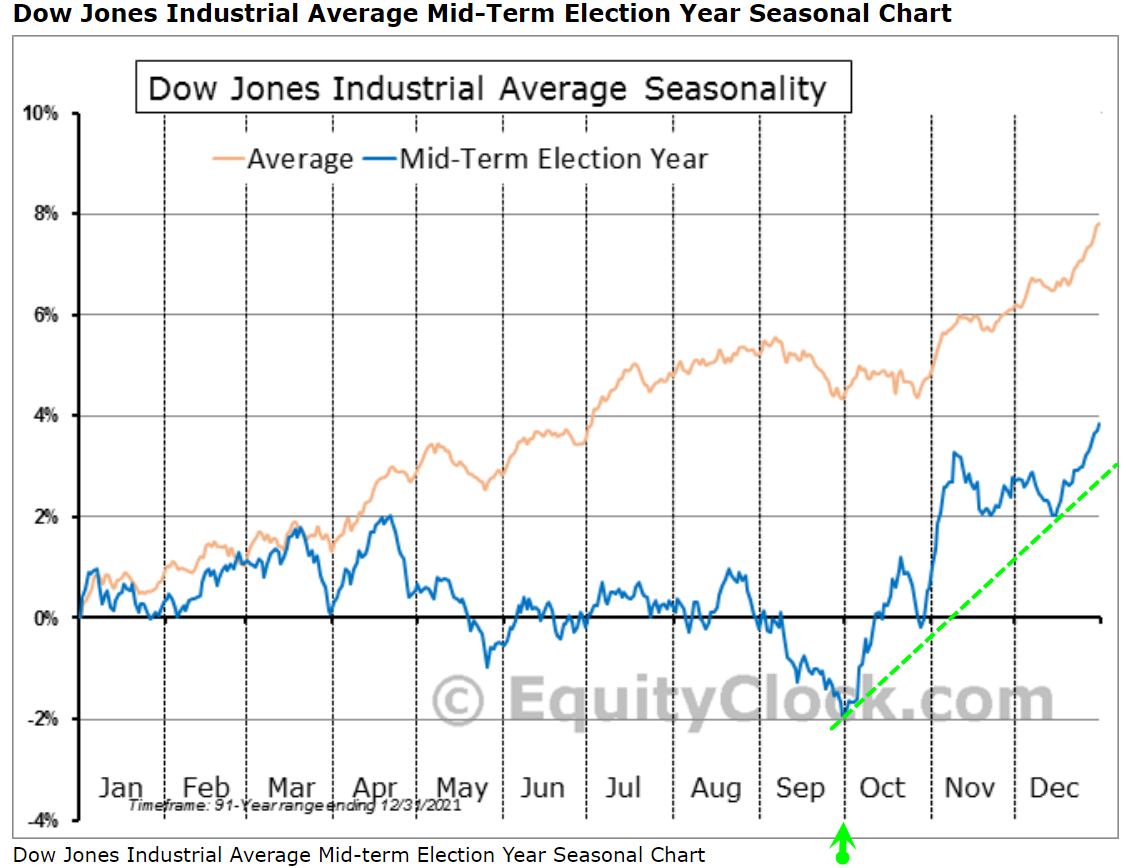
| Cycle Strength As the next two charts demonstrate, the Election Cycle has historically been positive for stock performance starting in October of the second year of an administration (see Figure 2). |

|
| Figure 2. The Dow Jones Industrial Average performance in mid-term years. Year 2022 is the second year of Biden’s presidency and the year of mid-term elections (November). |
| Graphic provided by: https://charts.equityclock.com/. |
| |
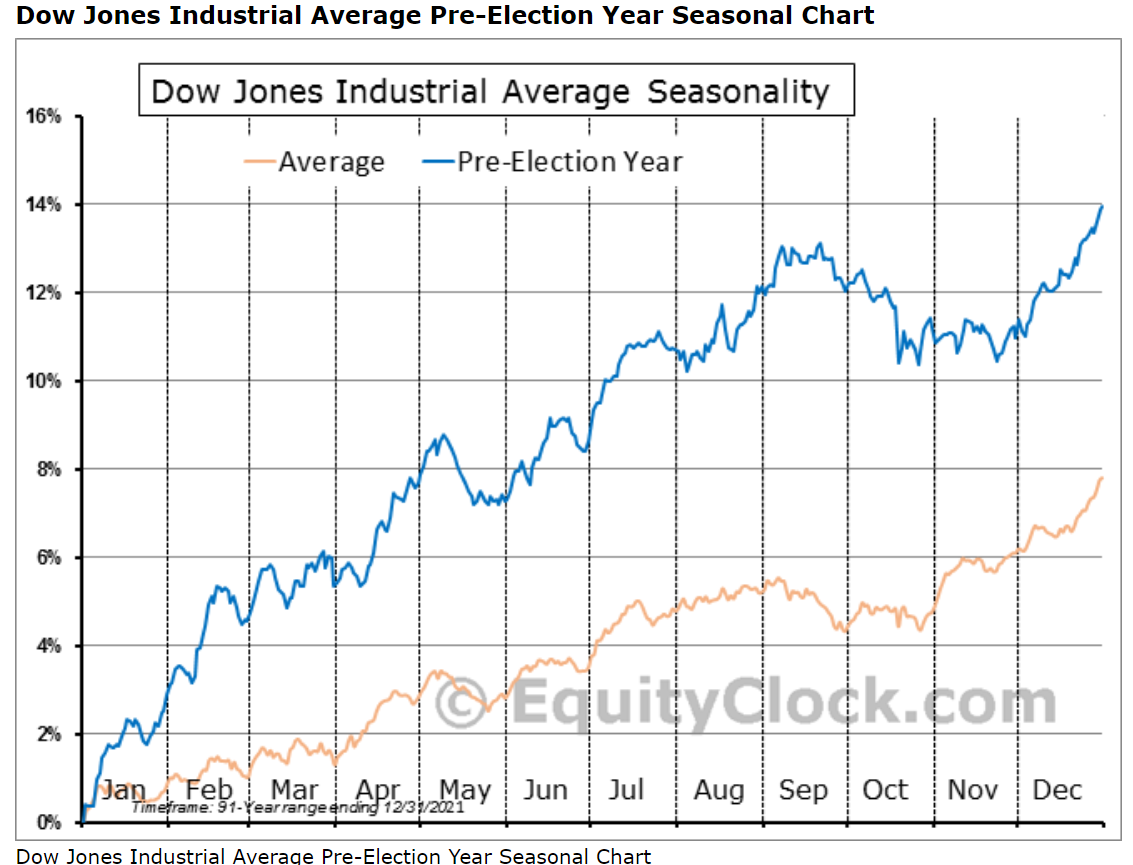
| As we see from Figure 3, year-three has historically been the strongest year for stocks over the last 100 years as administrations do all they can to "juice" the economy in the hopes of getting re-elected in the next election. As the chart shows, the Dow Jones Industrial Average has gained an average of 14% in year three. In other words, the environment for stocks will remain bullish from a cycle perspective for the next year plus! |

|
| Figure 3. Year 2023 is the pre-election year – a year in which stocks have registered their biggest gains historically. |
| Graphic provided by: https://charts.equityclock.com/. |
| |
| Williams highlighted a number of factors contributing to his bullish outlook on stocks from here but it is important to note that even the most bullish outlook can be derailed by unexpectedly bad news or financial data. In other words, it's great to be optimistic but the successful trader always has a plan if/when markets go south unexpectedly! |
| Suggested Reading: Island Trader: What's it like to trade from your own piece of paradise. Just ask Larry Williams. Get Ready - Markets Ready to Rock & Roll Dow Jones Election Cycle Charts |
Matt Blackman is a full-time technical and financial writer and trader. He produces corporate and financial newsletters, and assists clients in getting published in the mainstream media. Matt has earned the Chartered Market Technician (CMT) designation. Follow Matt on Twitter at www.twitter.com/RatioTrade
| Title: | Author |
| Company: | TradeSystemGuru |
| Address: | Box 2589 |
| Garibaldi Highlands, BC V0N1T0 | |
| Phone # for sales: | 6048989069 |
| E-mail address: | indextradermb@gmail.com |
Traders' Resource Links | |
| TradeSystemGuru has not added any product or service information to TRADERS' RESOURCE. | |
Click here for more information about our publications!
Comments

Request Information From Our Sponsors
- StockCharts.com, Inc.
- Candle Patterns
- Candlestick Charting Explained
- Intermarket Technical Analysis
- John Murphy on Chart Analysis
- John Murphy's Chart Pattern Recognition
- John Murphy's Market Message
- MurphyExplainsMarketAnalysis-Intermarket Analysis
- MurphyExplainsMarketAnalysis-Visual Analysis
- StockCharts.com
- Technical Analysis of the Financial Markets
- The Visual Investor
- VectorVest, Inc.
- Executive Premier Workshop
- One-Day Options Course
- OptionsPro
- Retirement Income Workshop
- Sure-Fire Trading Systems (VectorVest, Inc.)
- Trading as a Business Workshop
- VectorVest 7 EOD
- VectorVest 7 RealTime/IntraDay
- VectorVest AutoTester
- VectorVest Educational Services
- VectorVest OnLine
- VectorVest Options Analyzer
- VectorVest ProGraphics v6.0
- VectorVest ProTrader 7
- VectorVest RealTime Derby Tool
- VectorVest Simulator
- VectorVest Variator
- VectorVest Watchdog
