

HOT TOPICS LIST
- MACD
- Fibonacci
- RSI
- Gann
- ADXR
- Stochastics
- Volume
- Triangles
- Futures
- Cycles
- Volatility
- ZIGZAG
- MESA
- Retracement
- Aroon
INDICATORS LIST
LIST OF TOPICS
PRINT THIS ARTICLE
by Stella Osoba, CMT
Real Estate Investment Trusts (REITs) are modeled after mutual funds. They are often publicly traded and they purchase, manage and rent physical real estate. Typically, a particular REIT will have a specific property type they invest in like single-family homes, strip malls etc. Often, investors looking to get exposure to real estate without owning the physical asset will consider investing in REITS.
Position: N/A
Stella Osoba, CMT
Stella Osoba is a trader and financial writer. She is a frequent contributor to "Technical Analysis of Stocks and Commodities" magazine and "Traders.com Advantage" as well as other financial publications.
PRINT THIS ARTICLE
TECHNICAL ANALYSIS
To REIT Or Not To REIT?
08/11/22 04:03:48 PMby Stella Osoba, CMT
Real Estate Investment Trusts (REITs) are modeled after mutual funds. They are often publicly traded and they purchase, manage and rent physical real estate. Typically, a particular REIT will have a specific property type they invest in like single-family homes, strip malls etc. Often, investors looking to get exposure to real estate without owning the physical asset will consider investing in REITS.
Position: N/A
| Prologic Inc. (PLD) is a typical REIT. It is a publicly traded large capitalization fund in the real estate sector. It is listed on the NYSE. The fund invests in industrial and office real estate in high-barrier, high-growth markets. It was founded in 1991 and is headquartered in San Francisco, California. It currently has investments in properties totaling approximately 1.0 billion square feet distributed around 19 countries. |
| REITs are attractive to some individual investors because of their low cost of entry, their rich dividend payouts, especially in a low interest environment. Often viewed as a way to have a stake in real estate while avoiding the hassle of being a landlord, REITs were seen as a viable investment alternative. But as the economic outlook in the US has changed, and with talk of a looming recession as interest rates climb higher, are REITs still the good investment they once might have been? |
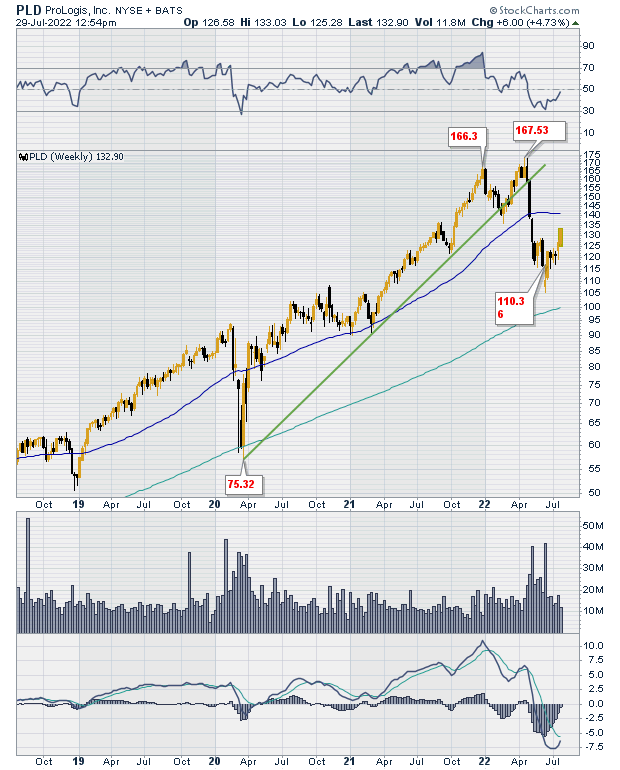
| Figure 1 is a weekly chart of PLD showing about 4 years of price history. We can see that after completing its V shaped reversal in March 2020, PLD went on to enter a very healthy uptrend, rising from $75 in May 2020 to $167 in April 2022. It touched $173.29 in April 2022 and that was to be its high. The following week, PLD tried to retake its price high, failed and plunged, decisively breaking its trendline |
|
| Figure 1. Weekly chart for PLD. |
| Graphic provided by: StockCharts.com. |
| |
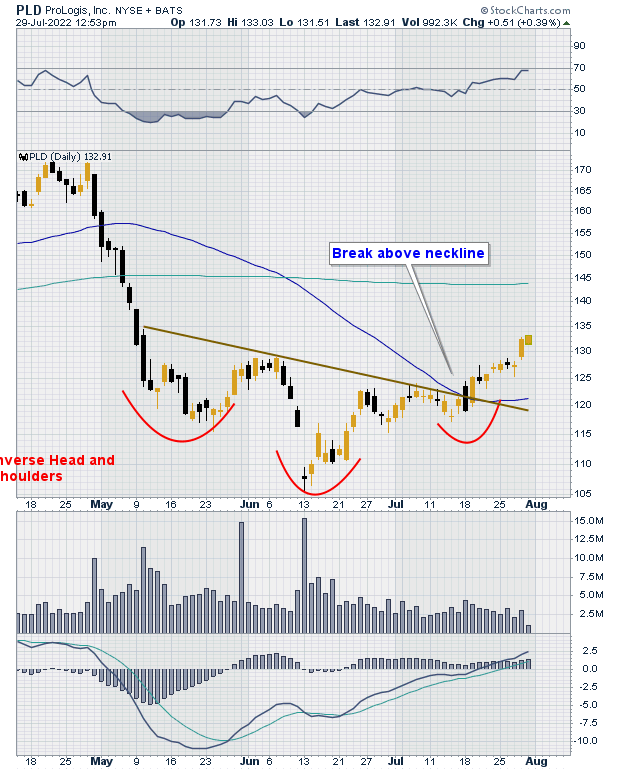
| Figure 2 shows a short-term daily chart of PLD's price action. We can see an inverse head and shoulders pattern forming which is short term bullish with its break above the neckline. It is interesting to note the contradictory information the PLD's price action is throwing off. An inverse head and shoulders is a bullish price pattern. But we are in an environment which is bearish, especially for REITs. These are highly leveraged instruments. They are therefore sensitive to interest rate hikes. So even though the short-term picture may seem bullish, REITs have vulnerabilities in recessionary environments that can make them less than ideal investments. Also, remember that PLD is still trading below its up-trend line, below its 50-day moving average. On the daily price chart, the 50-day moving average is still below the 200-day moving average. All bearish signals. |
|
| Figure 2. Daily chart for PLD. |
| Graphic provided by: StockCharts.com. |
| |
Stella Osoba is a trader and financial writer. She is a frequent contributor to "Technical Analysis of Stocks and Commodities" magazine and "Traders.com Advantage" as well as other financial publications.
| E-mail address: | stellaosoba@gmail.com |
Click here for more information about our publications!
PRINT THIS ARTICLE

Request Information From Our Sponsors
- VectorVest, Inc.
- Executive Premier Workshop
- One-Day Options Course
- OptionsPro
- Retirement Income Workshop
- Sure-Fire Trading Systems (VectorVest, Inc.)
- Trading as a Business Workshop
- VectorVest 7 EOD
- VectorVest 7 RealTime/IntraDay
- VectorVest AutoTester
- VectorVest Educational Services
- VectorVest OnLine
- VectorVest Options Analyzer
- VectorVest ProGraphics v6.0
- VectorVest ProTrader 7
- VectorVest RealTime Derby Tool
- VectorVest Simulator
- VectorVest Variator
- VectorVest Watchdog
- StockCharts.com, Inc.
- Candle Patterns
- Candlestick Charting Explained
- Intermarket Technical Analysis
- John Murphy on Chart Analysis
- John Murphy's Chart Pattern Recognition
- John Murphy's Market Message
- MurphyExplainsMarketAnalysis-Intermarket Analysis
- MurphyExplainsMarketAnalysis-Visual Analysis
- StockCharts.com
- Technical Analysis of the Financial Markets
- The Visual Investor