

HOT TOPICS LIST
- MACD
- Fibonacci
- RSI
- Gann
- ADXR
- Stochastics
- Volume
- Triangles
- Futures
- Cycles
- Volatility
- ZIGZAG
- MESA
- Retracement
- Aroon
INDICATORS LIST
LIST OF TOPICS
PRINT THIS ARTICLE
by Stella Osoba, CMT
How long is too long to hold a stock? Many people who seek to use technical analysis to trade have very short-term outlooks. Technical analysis is often conflated with day trading. But there is no reason not to use technical analysis to spot and enter long-term trading opportunities.
Position: N/A
Stella Osoba, CMT
Stella Osoba is a trader and financial writer. She is a frequent contributor to "Technical Analysis of Stocks and Commodities" magazine and "Traders.com Advantage" as well as other financial publications.
PRINT THIS ARTICLE
TECHNICAL ANALYSIS
The Long Play
07/14/22 03:32:48 PMby Stella Osoba, CMT
How long is too long to hold a stock? Many people who seek to use technical analysis to trade have very short-term outlooks. Technical analysis is often conflated with day trading. But there is no reason not to use technical analysis to spot and enter long-term trading opportunities.
Position: N/A
| MicroStrategy Incorporated (MSTR) will be used as an example to illustrate the idea of the long play. But this article is simply for educational purposes and not a recommendation to buy, sell or hold a position. As always, the reader is encouraged to do their own research. |
| MSTR was incorporated in 1989. It is a small cap growth stock engaged in data analytics, cloud and mobile services. In March 2000, shares traded for as high as $3,170. But six months later they had hit a low of $4.60. MSTR began trading on the NASDAQ on June 11, 1998 when it opened at $81.25. It has made parabolic moves up as well as parabolic moves down, but for most of its 24-year trading history it has stayed in a band close to about $100 with frequent fluctuations mostly above that price. Parabolic moves have happened, but not frequently. |
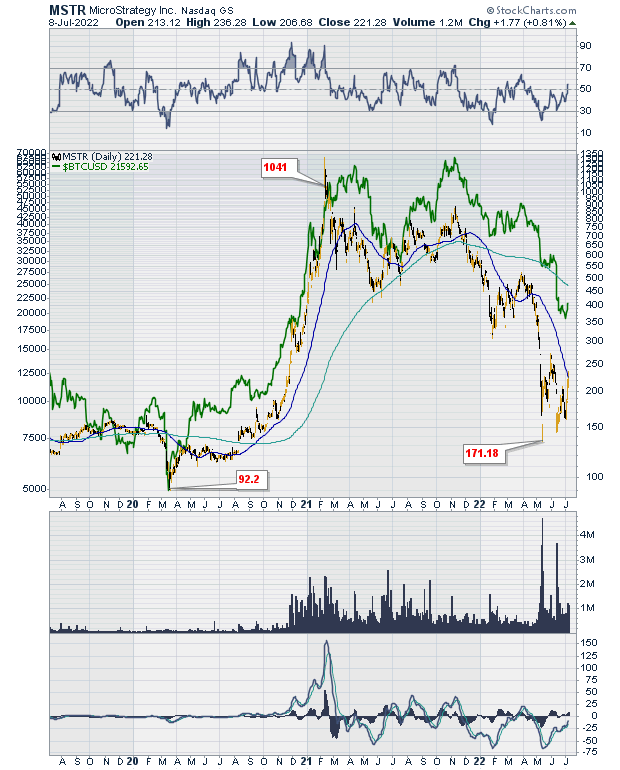
| The last parabolic move which we will pay attention to, began in 2020 (see Figure 1). MSTR fell to a low of about $90 in March of that year. Shortly after that decline it staged a V-shaped recovery. It tracked along its 50-day moving average for several months before breaking out in a gap up in August 2020. This was to be the beginning of a parabolic rise with the stock making a high of $1,315 in February of 2021. MSTR proceeded to make lower lows and lower highs and by May 12, 2022, was trading at a low of $134.09. Now there is no way to tell if the stock price will move any lower. It may well do, but it is interesting to note that MSTR may well be a bitcoin play. |
|
| Figure 1. Daily chart for MSTR. |
| Graphic provided by: StockCharts.com. |
| |
| Figure 1 shows MSTR's price moves which are in line with the price moves of Bitcoin ($BTCUSD). The parabolic move we observed in MSTR during 2020 was in line with Bitcoin's price rise. The price decline from 2021 to the present is also in line with Bitcoin's price decline. The reason for this is simple. The CEO of MSTR took a bet that inflation would make cash worthless and so in the summer of 2020 began buying Bitcoin in bulk. MSTR owns approximately 129,699 Bitcoin, bought at an average price of about $30,665 each. When the price of Bitcoin declined to around $18,900 on June 30, 2022, MSTR's value of the cryptocurrency also declined. |
| At the end of the first quarter of 2022, MSTR holdings in Bitcoin was worth about $5.9 billion, but by the second quarter those same holdings were worth about 53% less at around $2.45 billion. On May 3, 2022 during a conference call, the President and CFO of MSTR said "We view our Bitcoin holdings as long-term holdings and we do not currently plan to engage in sales of Bitcoin." With the head of digital assets research at BTIG putting a price target of Bitcoin at around $95,000 by the end of 2024, there might be sufficient upside to MSTR for another parabolic move if it continues to hold and accumulate Bitcoin. But even so, a lot can happen between now and 2024, remember nothing is guaranteed, and stocks do not have to do what you wish for them to do. |
Stella Osoba is a trader and financial writer. She is a frequent contributor to "Technical Analysis of Stocks and Commodities" magazine and "Traders.com Advantage" as well as other financial publications.
| E-mail address: | stellaosoba@gmail.com |
Click here for more information about our publications!
PRINT THIS ARTICLE

Request Information From Our Sponsors
- StockCharts.com, Inc.
- Candle Patterns
- Candlestick Charting Explained
- Intermarket Technical Analysis
- John Murphy on Chart Analysis
- John Murphy's Chart Pattern Recognition
- John Murphy's Market Message
- MurphyExplainsMarketAnalysis-Intermarket Analysis
- MurphyExplainsMarketAnalysis-Visual Analysis
- StockCharts.com
- Technical Analysis of the Financial Markets
- The Visual Investor
- VectorVest, Inc.
- Executive Premier Workshop
- One-Day Options Course
- OptionsPro
- Retirement Income Workshop
- Sure-Fire Trading Systems (VectorVest, Inc.)
- Trading as a Business Workshop
- VectorVest 7 EOD
- VectorVest 7 RealTime/IntraDay
- VectorVest AutoTester
- VectorVest Educational Services
- VectorVest OnLine
- VectorVest Options Analyzer
- VectorVest ProGraphics v6.0
- VectorVest ProTrader 7
- VectorVest RealTime Derby Tool
- VectorVest Simulator
- VectorVest Variator
- VectorVest Watchdog