HOT TOPICS LIST
- MACD
- Fibonacci
- RSI
- Gann
- ADXR
- Stochastics
- Volume
- Triangles
- Futures
- Cycles
- Volatility
- ZIGZAG
- MESA
- Retracement
- Aroon
INDICATORS LIST
LIST OF TOPICS
PRINT THIS ARTICLE
by Gary Grosschadl
A bullish pattern contained in a larger bearish one suggests that this could be traded successfully but may have limited upside.
Position: Hold
Gary Grosschadl
Independent Canadian equities trader and technical analyst based in Peterborough
Ontario, Canada.
PRINT THIS ARTICLE
CHART ANALYSIS
Wrong Way For Right Management Consultants Inc.?
01/16/03 08:33:55 AMby Gary Grosschadl
A bullish pattern contained in a larger bearish one suggests that this could be traded successfully but may have limited upside.
Position: Hold
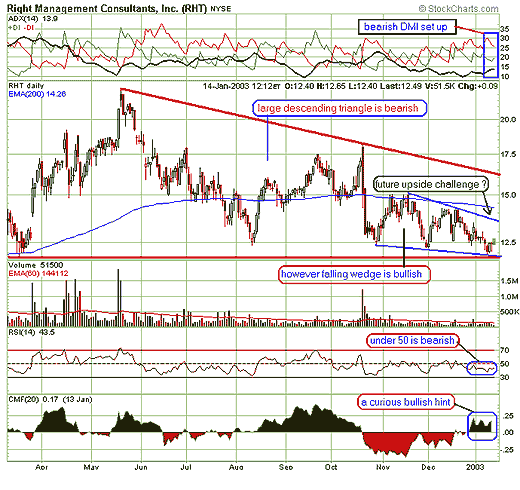
| In the past eight months this stock's value has been virtually cut in half. This drop has taken the shape of a descending triangle, a bearish formation. Normally volume contracts in these formations and this has been the case here, so much so that it can be considered a thin trader at times. Support lies at $12 and should this be violated, considerably more downside may lie ahead. |
| However, a closer look at the chart below reveals a smaller bullish formation contained within the ascending triangle - a bullish falling wedge. This tells the shorter term, higher risk trader that the chance of an upside test may be a short-term trading opportunity. The aggressive play here would be to go long on the next close above $13 which is nearby resistance. A move up to test the wedge's top trendline may ensue and it could go further to test the 200-day EMA, currently at $14.25. A vigorous move could even lead to a much bigger test-- that of the long term top trendline of the descending triangle. |

|
| Graphic provided by: StockCharts.com. |
| |
| A more prudent trading strategy would be to wait for a significant pattern break, either up or down. Failure at the bottom resistance line could be a shorting opportunity while a push past the falling wedge pattern (on good volume) could be a good opportunity for traders taking long positions. |
| Looking at the indicators, only one has a hint of bullish promise. The Chaikin Money Flow oscillator generates bullish signals by indicating that a security is under accumulation. After two months of bearish signals, this indicator has risen into bullish territory, probably as other traders anticipated a bounce off longer term support. |
| So in summary, we have a possibility of a move up to test overhead resistance for a riskier shorter term trade. The more patient and prudent trader may be better served to wait for a pattern break either below $12 support or above $13.50 where the wedge trendline lies. If that upside move happens, beware any sudden reversal at the 200-day EMA line. |
Independent Canadian equities trader and technical analyst based in Peterborough
Ontario, Canada.
| Website: | www.whatsonsale.ca/financial.html |
| E-mail address: | gwg7@sympatico.ca |
Click here for more information about our publications!
PRINT THIS ARTICLE

Request Information From Our Sponsors
- VectorVest, Inc.
- Executive Premier Workshop
- One-Day Options Course
- OptionsPro
- Retirement Income Workshop
- Sure-Fire Trading Systems (VectorVest, Inc.)
- Trading as a Business Workshop
- VectorVest 7 EOD
- VectorVest 7 RealTime/IntraDay
- VectorVest AutoTester
- VectorVest Educational Services
- VectorVest OnLine
- VectorVest Options Analyzer
- VectorVest ProGraphics v6.0
- VectorVest ProTrader 7
- VectorVest RealTime Derby Tool
- VectorVest Simulator
- VectorVest Variator
- VectorVest Watchdog
- StockCharts.com, Inc.
- Candle Patterns
- Candlestick Charting Explained
- Intermarket Technical Analysis
- John Murphy on Chart Analysis
- John Murphy's Chart Pattern Recognition
- John Murphy's Market Message
- MurphyExplainsMarketAnalysis-Intermarket Analysis
- MurphyExplainsMarketAnalysis-Visual Analysis
- StockCharts.com
- Technical Analysis of the Financial Markets
- The Visual Investor
