

HOT TOPICS LIST
- MACD
- Fibonacci
- RSI
- Gann
- ADXR
- Stochastics
- Volume
- Triangles
- Futures
- Cycles
- Volatility
- ZIGZAG
- MESA
- Retracement
- Aroon
INDICATORS LIST
LIST OF TOPICS
PRINT THIS ARTICLE
by Stella Osoba, CMT
With lots of stocks making new lows, many charts are beginning to show positive divergencies when compared with their indicators.
Position: N/A
Stella Osoba, CMT
Stella Osoba is a trader and financial writer. She is a frequent contributor to "Technical Analysis of Stocks and Commodities" magazine and "Traders.com Advantage" as well as other financial publications.
PRINT THIS ARTICLE
TECHNICAL ANALYSIS
Positive Divergence
07/14/22 03:28:15 PMby Stella Osoba, CMT
With lots of stocks making new lows, many charts are beginning to show positive divergencies when compared with their indicators.
Position: N/A
| A positive divergence happens when price makes a lower low while the indicator makes a higher low. What this technical pattern means is that while price is confirming the current downtrend, the indicator is showing decreasing momentum. This could be a signal that the downtrend is losing force. When a downtrend signals that it is losing force, this could be an early warning of a potential price reversal. This is a useful signal to pay attention to. Remember that confirmation of any signals should come from price, not the indicator. |
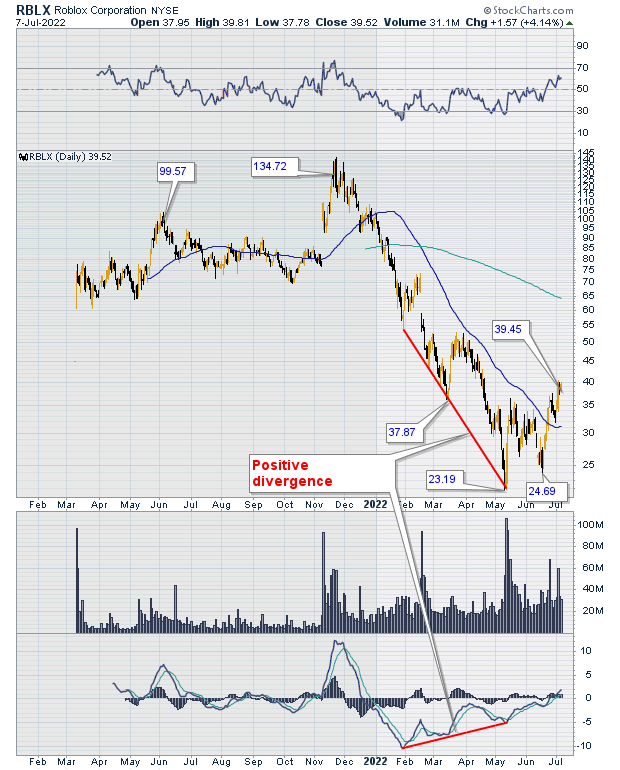
| Roblox Corporation (RBLX) is a mid-cap technology company in the Communication Services sector. Players can interact with each other to explore and develop gaming content and other live services. After reaching a high of $141.60 on November 22, 2021(see Figure 1), the stock price had plunged to a low of $21.89 by May 11, 2022. But the astute observer would have noticed that after the dip on January 27, 2022, the MACD began to rise so that when RBLX made its next low on March 18,2022 at $36.04, the MACD made a higher low. Price and the MACD had formed a positive divergence. |
|
| Figure 1. RBLX Daily. |
| Graphic provided by: StockCharts.com. |
| |
| The next low RBLX formed was on May 10, 2022, when price touched a low of $21.65. The MACD made another higher low, clearly marking the decreasing momentum of the price decline. Confirmation of the positive divergence in this instance for a long trade would have been the next low, but only if it was higher than the previous low. The higher low implies buyers coming into the market and pushing the stock price up. On June 16, 2022, RBLX made a low of $23.88 which was higher than the prior low of May 10. 2022. Price has continued to rise, currently breaking up above the 50-day moving average. |
| Price still has a long way to go to reach its year-ago highs. Remember, that on November 22, 2021, price was above $140. The current price action is not indicative of a change in trend. That might be too early to call in the present environment. Also, it is still bearish that RBLX is trading below its 200-day moving average which remains above the 50-day moving average. But traders looking to get in the market when shares are on sale might find the price attractive. As always remember that depending on what happens with the individual stock and also the wider market, price can always go lower. Divergences are not always guaranteed to work. |
Stella Osoba is a trader and financial writer. She is a frequent contributor to "Technical Analysis of Stocks and Commodities" magazine and "Traders.com Advantage" as well as other financial publications.
| E-mail address: | stellaosoba@gmail.com |
Click here for more information about our publications!
PRINT THIS ARTICLE

Request Information From Our Sponsors
- StockCharts.com, Inc.
- Candle Patterns
- Candlestick Charting Explained
- Intermarket Technical Analysis
- John Murphy on Chart Analysis
- John Murphy's Chart Pattern Recognition
- John Murphy's Market Message
- MurphyExplainsMarketAnalysis-Intermarket Analysis
- MurphyExplainsMarketAnalysis-Visual Analysis
- StockCharts.com
- Technical Analysis of the Financial Markets
- The Visual Investor
- VectorVest, Inc.
- Executive Premier Workshop
- One-Day Options Course
- OptionsPro
- Retirement Income Workshop
- Sure-Fire Trading Systems (VectorVest, Inc.)
- Trading as a Business Workshop
- VectorVest 7 EOD
- VectorVest 7 RealTime/IntraDay
- VectorVest AutoTester
- VectorVest Educational Services
- VectorVest OnLine
- VectorVest Options Analyzer
- VectorVest ProGraphics v6.0
- VectorVest ProTrader 7
- VectorVest RealTime Derby Tool
- VectorVest Simulator
- VectorVest Variator
- VectorVest Watchdog