

HOT TOPICS LIST
- MACD
- Fibonacci
- RSI
- Gann
- ADXR
- Stochastics
- Volume
- Triangles
- Futures
- Cycles
- Volatility
- ZIGZAG
- MESA
- Retracement
- Aroon
INDICATORS LIST
LIST OF TOPICS
PRINT THIS ARTICLE
by Mark Rivest
See why US stocks may have begun a multi-year bear market.
Position: N/A
Mark Rivest
Independent investment advisor, trader and writer. He has written articles for Technical Analysis of Stocks & Commodities, Traders.com Advantage,Futuresmag.com and, Finance Magnates. Author of website Four Dimension Trading.
PRINT THIS ARTICLE
FIBONACCI
Long-Term Fibonacci Time Relationships
06/29/22 03:37:11 PMby Mark Rivest
See why US stocks may have begun a multi-year bear market.
Position: N/A
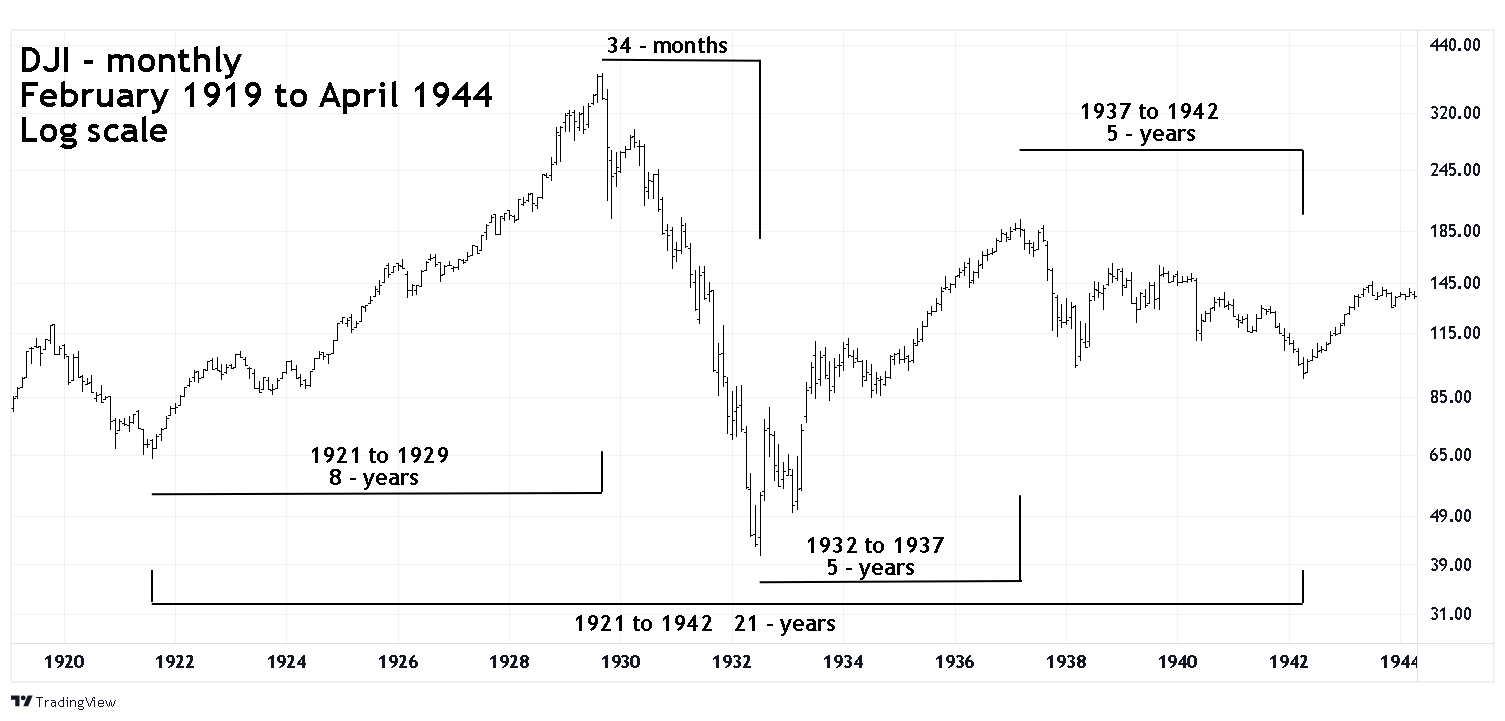
| Decades ago, R.N . Elliott discovered the Wave theory of market movements which is now named after him. Subsequently he found that the Wave theory was closely related to the Fibonacci sequence and ratios which can be used for both price and time. Elliott's time analysis of the Dow Jones Industrial Average (DJI) in the first half of the twentieth century is a template for what's happened in the first quarter of the twenty-first century. Dow Jones Industrial Average - 1921 to 1942 The Fibonacci sequence is as follows (1, 1, 2, 3, 5, 8, 13, 21, 34, 55, 89, 144, ----- to infinity). Some of the main Fibonacci ratios are 1/1 = 1.00 equality, 1/2 = .50, 34/55= .618, 34/89 = .382. Please see the monthly DJI chart 1919 to 1944 illustrated in Figure 1. These are some of the Fibonacci time relationship that Elliott discovered. He also found the concept can also be measured in months — the 1929 to 1932 bear market was a Fibonacci 34 months. Measured from year to year its 3 years and is related by the Fibonacci ratio of 3/5 or .60 with the 1937 to 1942 bear market. There's also a Fibonacci ratio relationship of the 1932 to 1937 bull market with the 1921 to 1929 bull market — 5/8 or .625. The 1932 to 1937 5 year bull market is equal to the 5 year bear market 1937 to 1942. These Fibonacci time relationships could be important clues to the direction of the DJI in 2022 and beyond. |
|
| Figure 1. These Fibonacci time relationships could be important clues to the direction of the DJI in 2022 and beyond. |
| Graphic provided by: TradingView. |
| |
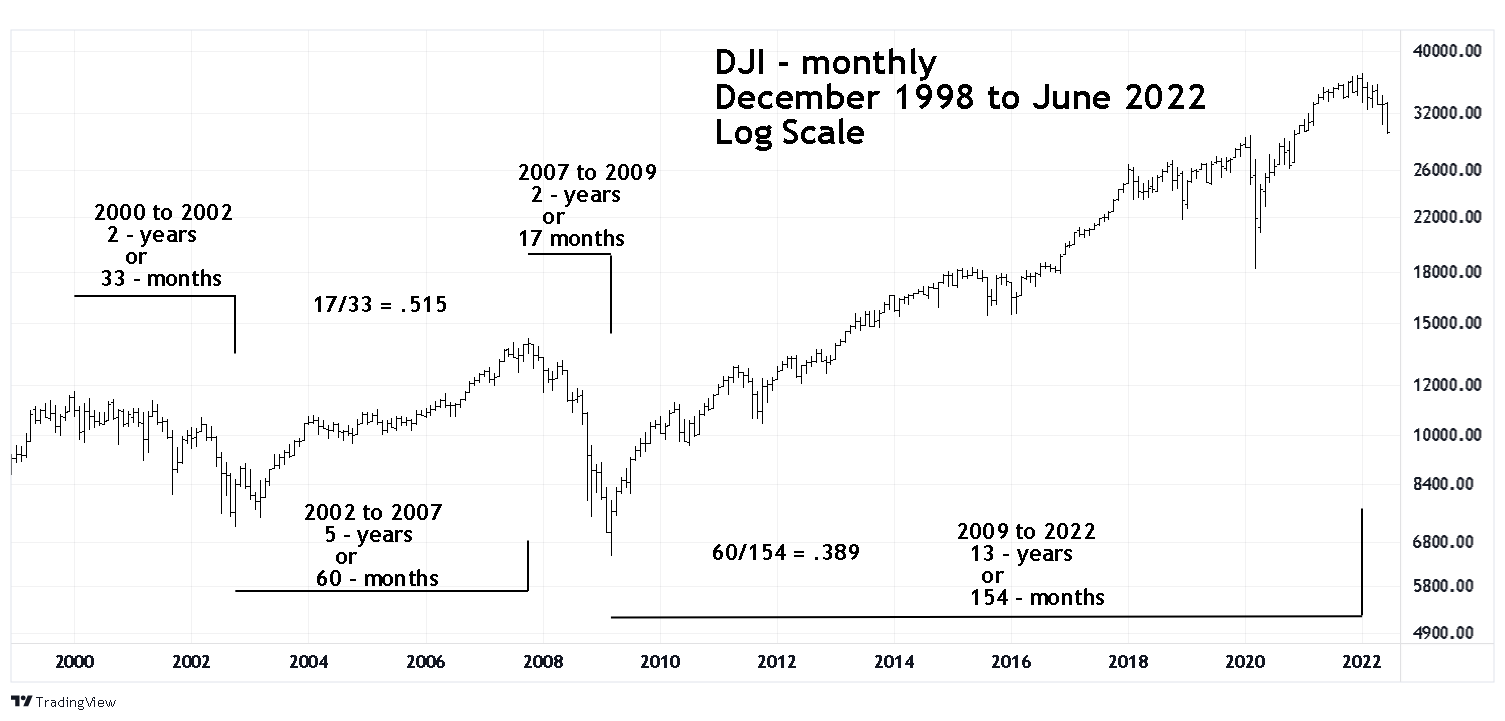
| Dow Jones Industrial Average - 2000 to 2022 Please see the monthly DJI chart 1998 to 2022 illustrated in Figure 2. None of the monthly numbers are in the Fibonacci sequence, there are however several Fibonacci ratio relationships. The most interesting relationship is the DJI 2000 to 2002 bear market of 33 months nearly equals the DJI the 1929 to 1932 bear market. The 2007 to 2009 bear market was 17 months . The 2000 to 2002 bear market was 33 months — a ratio of .515, close to a Fibonacci .50. The 2002 to 2007 bull market was to the day an exact Fibonacci 5 years! This precision over a multi-year span is amazing. The ratio of this 60-month bull market to the 154-month bull market from 2009 to 2022 is .389, close to the Fibonacci ratio of .382. The DJI 1942 bottom was the starting point for a significant bull market. If the DJI January 2022 peak is a turning point similar in importance to the DJI 1942 bottom, how long could a post DJI 2022 decline last? The record of DJI bear markets since 1929 provides some guidance. Measured from year to year the major DJI bear markets are as follows: 1929 + 3- years = 1932 1937 + 5 - years = 1942 1968 + 2 - years = 1970 1973 + 1- year = 1974 2000 + 2- years = 2002 2007 + 2 years = 2009 2022 + ? One of the guidelines in Elliott wave theory is alternation — expect something different. The prior two DJI bear markets measured from year to year were "2". If we expect something different, the current presumed bear market probably won't be ending in 2024. Of the Fibonacci sequence numbers (1, 2, 3, and 5) the number "5" is the most interesting. From 1932 to 1942 the DJI had a 5-year bull market followed by a 5-year bear market. It's been over 80 years since the DJI had a 5-year bear market — 1937 to 1942. A new 5-year stock market decline is probably not expected. Additionally, the 1937 to 1942 bear market came immediately after a five-year bull market. In the early twenty-first century the sequence could be a five-year bull market with intervening bear and bull markets followed by a five-year bear market. The history of Fibonacci time cycles alert us to potential major trend changes. The DJI decline after the January 2022 top could be the early part of a bear market lasting for one, two, three, or possibly five years. Further Reading: Prechter Jr. R Robert - Editor (1980) "The Major Works of R.N. Elliott" New Classics Library. Frost A.J and Robert Prechter (1985) "Elliott Wave Principle", New Classics Library. Prechter Jr. R. Robert (2003) "Beautiful Pictures", New Classics Library. |
|
| Figure 2 The most interesting relationship is the DJI 2000 to 2002 bear market of 33 months nearly equals the DJI 1929 to 1932 bear market. |
| Graphic provided by: TradingView. |
| |
Independent investment advisor, trader and writer. He has written articles for Technical Analysis of Stocks & Commodities, Traders.com Advantage,Futuresmag.com and, Finance Magnates. Author of website Four Dimension Trading.
| Website: | www.fourdimensiontrading.com |
| E-mail address: | markrivest@gmail.com |
Click here for more information about our publications!
PRINT THIS ARTICLE

Request Information From Our Sponsors
- StockCharts.com, Inc.
- Candle Patterns
- Candlestick Charting Explained
- Intermarket Technical Analysis
- John Murphy on Chart Analysis
- John Murphy's Chart Pattern Recognition
- John Murphy's Market Message
- MurphyExplainsMarketAnalysis-Intermarket Analysis
- MurphyExplainsMarketAnalysis-Visual Analysis
- StockCharts.com
- Technical Analysis of the Financial Markets
- The Visual Investor
- VectorVest, Inc.
- Executive Premier Workshop
- One-Day Options Course
- OptionsPro
- Retirement Income Workshop
- Sure-Fire Trading Systems (VectorVest, Inc.)
- Trading as a Business Workshop
- VectorVest 7 EOD
- VectorVest 7 RealTime/IntraDay
- VectorVest AutoTester
- VectorVest Educational Services
- VectorVest OnLine
- VectorVest Options Analyzer
- VectorVest ProGraphics v6.0
- VectorVest ProTrader 7
- VectorVest RealTime Derby Tool
- VectorVest Simulator
- VectorVest Variator
- VectorVest Watchdog