

HOT TOPICS LIST
- MACD
- Fibonacci
- RSI
- Gann
- ADXR
- Stochastics
- Volume
- Triangles
- Futures
- Cycles
- Volatility
- ZIGZAG
- MESA
- Retracement
- Aroon
INDICATORS LIST
LIST OF TOPICS
PRINT THIS ARTICLE
by Stella Osoba, CMT
Price channels, also known as Donchian channels, were developed by Richard Donchian (1905-1993). Donchian was a pioneer in the field of commodities and futures trading. In 1949 he established the first futures fund. His rule based trading system became the basis for many modern trend following systems including the famous Turtle Trading System.
Position: N/A
Stella Osoba, CMT
Stella Osoba is a trader and financial writer. She is a frequent contributor to "Technical Analysis of Stocks and Commodities" magazine and "Traders.com Advantage" as well as other financial publications.
PRINT THIS ARTICLE
TREND-CHANNEL
Using Price Channels
06/23/22 03:10:14 PMby Stella Osoba, CMT
Price channels, also known as Donchian channels, were developed by Richard Donchian (1905-1993). Donchian was a pioneer in the field of commodities and futures trading. In 1949 he established the first futures fund. His rule based trading system became the basis for many modern trend following systems including the famous Turtle Trading System.
Position: N/A
| Price channels, as the name implies, are simply channels mostly encompassing price. The channels are designed to help us see the trend more clearly and trade in the direction of the trend. The channels are comprised of three lines. There is an upper band, a lower band and a middle line. Each line is calculated separately. Typically a 20-day value is used in the calculation of bands (But any time period can be used depending on your trading time frame). For the upper band, the highest price in the prior 20 days is used, for the lower band, the lowest price in the prior 20 days is used, and for the middle band, the difference between the readings for the upper band and the lower band is used. The price reading for the current or most recent period is not used in the calculation. |
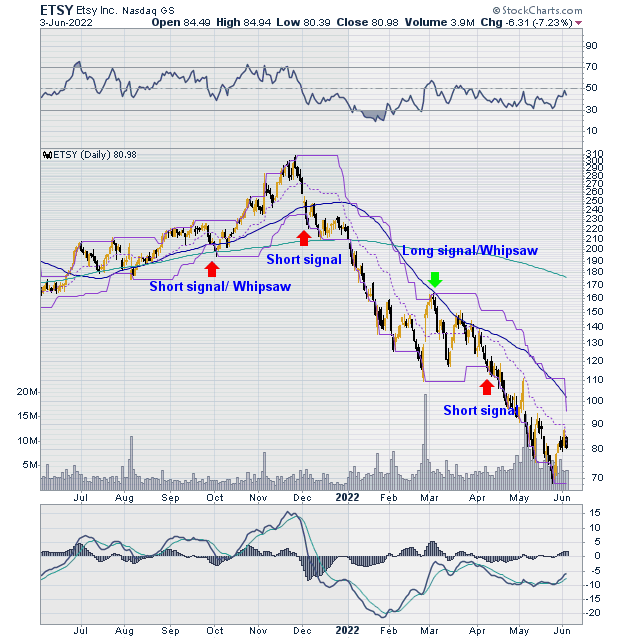
| To illustrate using price channels in trading I will use the stock of ETSY Inc. (ETSY). ETSY is a mid cap growth stock, specializing in the operation of an online marketplace. It is in the consumer discretionary sector. After price made a high of 307.75 on November 26, 2021 the trend changed and price began a long downtrend which continues as of the writing of this article (See Figure 1). |
|
| Figure 1. Daily chart for ETSY. |
| Graphic provided by: StockCharts.com. |
| |
| When using price channels, weakness in price is denoted by a fall below the lower line of the price channel, while strength is denoted by a rise above the upper line of the price channel. The fall below the lower price line on December 3, 2021, would have been a signal to go short in this time frame. The interpretation is that the fall below the 20-day lower price band is indicative of weakness and selling pressure. Price is making new 20-day lows. It is therefore likely that the trend will continue downwards for a certain period of time. |
| The Donchian channel is a trading strategy which aims to keep a trader always in the market, either long or short. You can either use the cross of the middle band to denote when to exit positions, or to avoid whipsaws wait to see if there is a cross above the opposite band. The system does not require you to get in at the lows and out at the highs or vice versa. But successful trading will likely mean that you are in the trade for a good amount of the move as you can see on the chart. Also be aware that this system does not prevent you from whipsaws. Many times price will move above or below the upper or lower line and not follow through. This is to be expected. But if you can keep your nerves about you, when price does settle into its trend, you will be well positioned to take advantage of it. |
Stella Osoba is a trader and financial writer. She is a frequent contributor to "Technical Analysis of Stocks and Commodities" magazine and "Traders.com Advantage" as well as other financial publications.
| E-mail address: | stellaosoba@gmail.com |
Click here for more information about our publications!
Comments
Date:�07/10/22Rank:�5Comment:�

Request Information From Our Sponsors
- VectorVest, Inc.
- Executive Premier Workshop
- One-Day Options Course
- OptionsPro
- Retirement Income Workshop
- Sure-Fire Trading Systems (VectorVest, Inc.)
- Trading as a Business Workshop
- VectorVest 7 EOD
- VectorVest 7 RealTime/IntraDay
- VectorVest AutoTester
- VectorVest Educational Services
- VectorVest OnLine
- VectorVest Options Analyzer
- VectorVest ProGraphics v6.0
- VectorVest ProTrader 7
- VectorVest RealTime Derby Tool
- VectorVest Simulator
- VectorVest Variator
- VectorVest Watchdog
- StockCharts.com, Inc.
- Candle Patterns
- Candlestick Charting Explained
- Intermarket Technical Analysis
- John Murphy on Chart Analysis
- John Murphy's Chart Pattern Recognition
- John Murphy's Market Message
- MurphyExplainsMarketAnalysis-Intermarket Analysis
- MurphyExplainsMarketAnalysis-Visual Analysis
- StockCharts.com
- Technical Analysis of the Financial Markets
- The Visual Investor