

HOT TOPICS LIST
- MACD
- Fibonacci
- RSI
- Gann
- ADXR
- Stochastics
- Volume
- Triangles
- Futures
- Cycles
- Volatility
- ZIGZAG
- MESA
- Retracement
- Aroon
INDICATORS LIST
LIST OF TOPICS
PRINT THIS ARTICLE
by Stella Osoba, CMT
On May 6, 2022, the DOW plunged over 1,000 points. The S&P 500 and NASDAQ also posted severe losses. By this time, many popular growth stocks had lost over 50% of their values and were firmly in bear market territory. One of the few sectors that seemed to have escaped the worst of the rout was consumer staples. This sector is populated by value stocks many of which seem to be serenely unaffected by the current state of chaos in the larger market.
Position: N/A
Stella Osoba, CMT
Stella Osoba is a trader and financial writer. She is a frequent contributor to "Technical Analysis of Stocks and Commodities" magazine and "Traders.com Advantage" as well as other financial publications.
PRINT THIS ARTICLE
REV HEAD & SHOULDERS
Value Stock
05/26/22 04:11:27 PMby Stella Osoba, CMT
On May 6, 2022, the DOW plunged over 1,000 points. The S&P 500 and NASDAQ also posted severe losses. By this time, many popular growth stocks had lost over 50% of their values and were firmly in bear market territory. One of the few sectors that seemed to have escaped the worst of the rout was consumer staples. This sector is populated by value stocks many of which seem to be serenely unaffected by the current state of chaos in the larger market.
Position: N/A
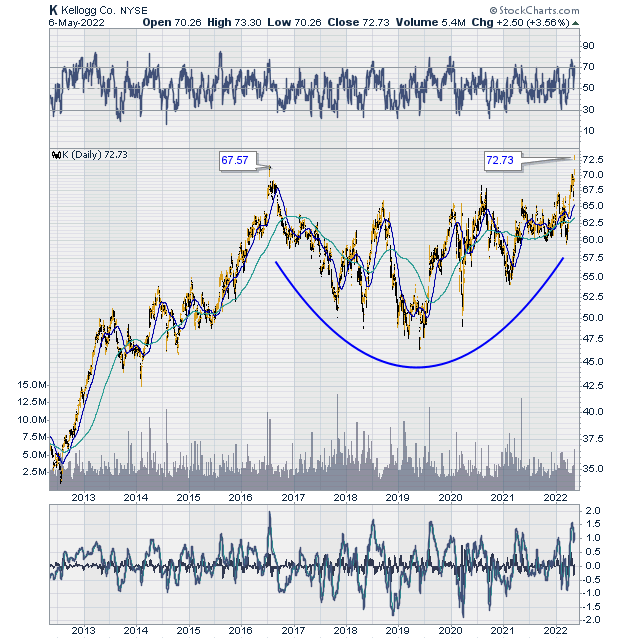
| In 1894 W.K Kelloggs (K) created a toasted breakfast cereal known as cornflakes. The company is now a global manufacturer of food products like granola bars, breakfast cereals, frozen waffles and more. Its market capitalization as of May 7, 2022 was $24.69B, making it a mid-capitalization value stock. |
|
| Figure 1. Daily chart for K (2013-2022) |
| Graphic provided by: StockCharts.com. |
| |
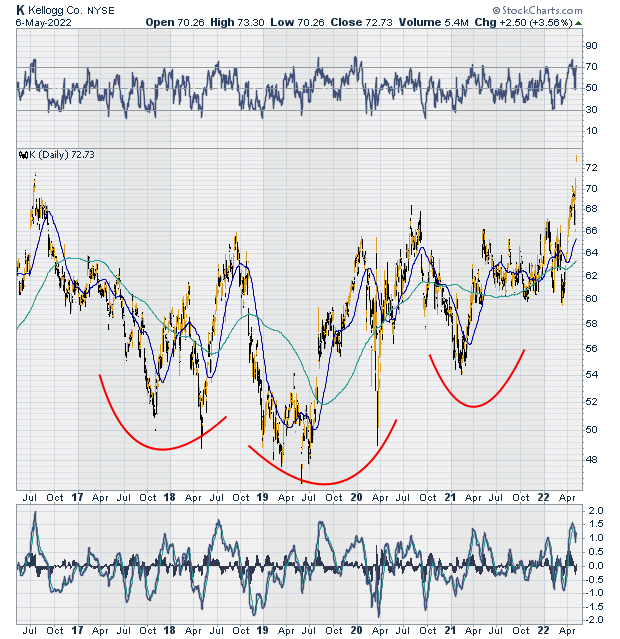
| In times of soaring uptrends, this stock might not rate a second look. Its share price has been lackluster and there is almost no trend to speak of. On July 20, 2016, K closed at a high of 67.57. Over the following years, its price has traded mostly down and sideways, fluctuating between a range of high 40s to high 60s (See Figure 1). In fact, it is possible to map out an inverse head and shoulders price pattern (See Figure 2). Squint a little. |
|
| Figure 2. Daily chart for K (2017-2022). |
| Graphic provided by: StockCharts.com. |
| |
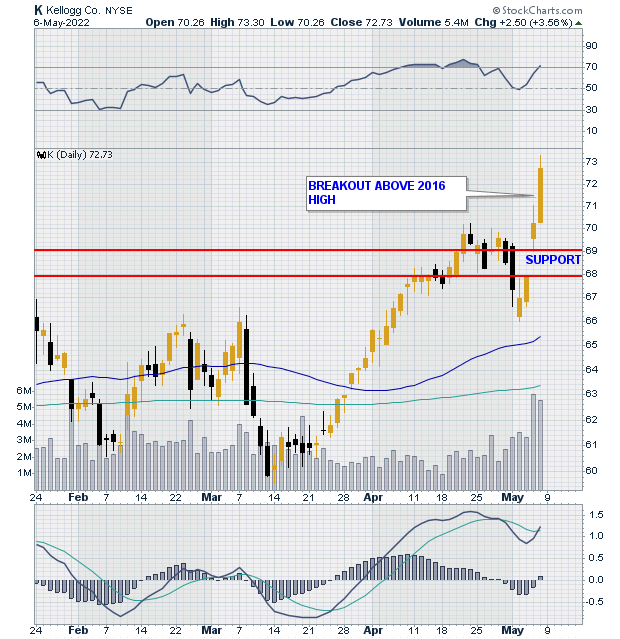
| On May 5, 2022, K reported a 15% jump in first quarter earnings leading to a gap up in the stock. This happened on the same day that the Dow Jones Industrial Average shedded over 1,000 points. The following day, K posted even more impressive gains, closing at an all-time high of 72.73. It also broke out above its 2016 high (See Figure 3). |
|
| Figure 3. Daily chart for K (2022). |
| Graphic provided by: StockCharts.com. |
| |
| K is a component of the consumer staples sector. Stocks in this sector tend to perform best best when the economy as a whole is struggling or contracting. Stocks in the consumer staples sector represent stocks that are necessary for everyday life such as detergent, toothpaste, groceries etc. No matter what the economy does, people still need these products. So, there is a steady demand for them. |
| Value stocks are often not fast moving like growth stocks for most of the time especially in healthy markets. But having some value stock exposure can help insulate your portfolio in uncertain times. They tend to perform better than growth stocks when markets are contracting and they offer something most growth stocks do not — dividends. K's annual dividend is $2.32 with a yield of 3.19% which in tough markets offers a rare glimmer of light. |
Stella Osoba is a trader and financial writer. She is a frequent contributor to "Technical Analysis of Stocks and Commodities" magazine and "Traders.com Advantage" as well as other financial publications.
| E-mail address: | stellaosoba@gmail.com |
Click here for more information about our publications!
PRINT THIS ARTICLE

Request Information From Our Sponsors
- VectorVest, Inc.
- Executive Premier Workshop
- One-Day Options Course
- OptionsPro
- Retirement Income Workshop
- Sure-Fire Trading Systems (VectorVest, Inc.)
- Trading as a Business Workshop
- VectorVest 7 EOD
- VectorVest 7 RealTime/IntraDay
- VectorVest AutoTester
- VectorVest Educational Services
- VectorVest OnLine
- VectorVest Options Analyzer
- VectorVest ProGraphics v6.0
- VectorVest ProTrader 7
- VectorVest RealTime Derby Tool
- VectorVest Simulator
- VectorVest Variator
- VectorVest Watchdog
- StockCharts.com, Inc.
- Candle Patterns
- Candlestick Charting Explained
- Intermarket Technical Analysis
- John Murphy on Chart Analysis
- John Murphy's Chart Pattern Recognition
- John Murphy's Market Message
- MurphyExplainsMarketAnalysis-Intermarket Analysis
- MurphyExplainsMarketAnalysis-Visual Analysis
- StockCharts.com
- Technical Analysis of the Financial Markets
- The Visual Investor