

HOT TOPICS LIST
- MACD
- Fibonacci
- RSI
- Gann
- ADXR
- Stochastics
- Volume
- Triangles
- Futures
- Cycles
- Volatility
- ZIGZAG
- MESA
- Retracement
- Aroon
INDICATORS LIST
LIST OF TOPICS
PRINT THIS ARTICLE
by Taylor Ireland
In this article, we examine the market structure of a Gap Higher Open in the WTI futures market that resulted in a continuation of the rally to 115.40s on Wednesday, March 23, 2022. Market structure provides insight into the market's dual-auction price discovery process. Analysis of this data provides a structural and statistical framework of these market structures, informing one's risk management process.
Position: N/A
Taylor Ireland
Sharedata Futures, Inc. provides historical data mining and visualization for the benchmark NYMEX Energy Futures Markets.
Sharedata combines structural analysis of the market generated data, dynamic systems analysis, and Bayesian causal inference techniques favored by the scientific and intelligence communities to provide a robust framework for addressing the uncertainty and risk in energy pricing.
PRINT THIS ARTICLE
GAPS
Gap Higher Open Structure Led To Continuation Of The Rally
05/19/22 03:26:31 PMby Taylor Ireland
In this article, we examine the market structure of a Gap Higher Open in the WTI futures market that resulted in a continuation of the rally to 115.40s on Wednesday, March 23, 2022. Market structure provides insight into the market's dual-auction price discovery process. Analysis of this data provides a structural and statistical framework of these market structures, informing one's risk management process.
Position: N/A
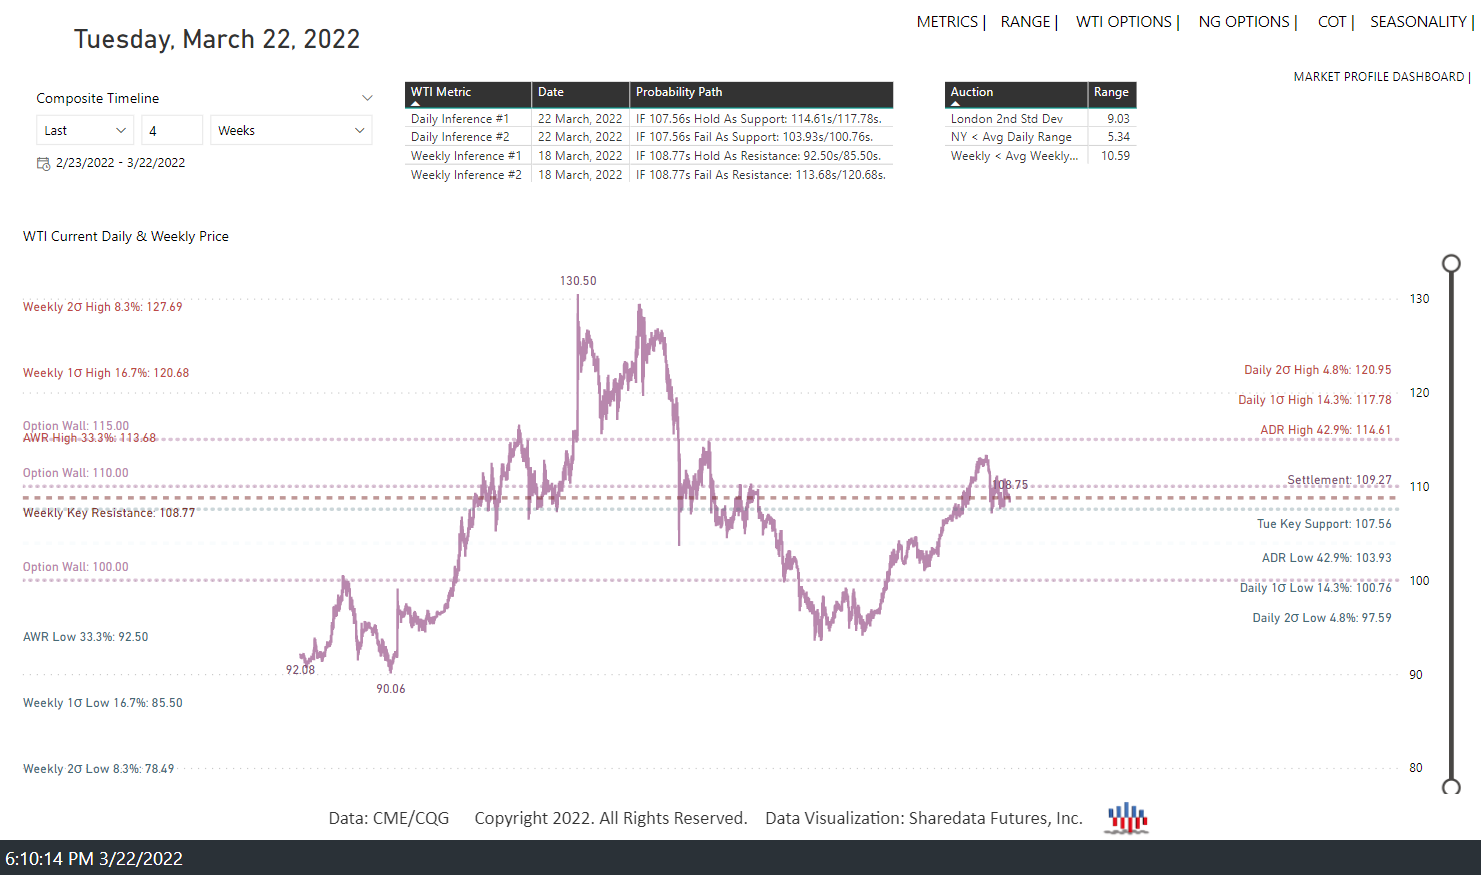
| March 23 2022: The primary expectation in Sharedata's Energy Daily Dashboard for Wednesday 23 March 2022's auction was for price discovery higher. Our daily dual probability path assigned the primary expectation for price discovery higher, noting statistical resistance targets were: 114.61s/117.78s/120.95s, respectively. Qualitatively, these levels had held as resistance 58%, 86%, and 95% of recent market auctions, respectively, based on the market generated data. This data provided a buy-side framework with a probable resistance "zone" between 114.61s-117.78s. This type of daily framework, while useful, is more effective when used with structural analysis (in the form of the Market Profile) to confirm or negate the most probable daily inference. In this case, daily key support held before a breakout in Wednesday's Globex auction drove price higher to 113.48s as a Gap Higher Open formed into the NY open. |
|
| Figure 1. Energy Daily Dashboard 22 Mar 2022. |
| Graphic provided by: Sharedata Futures, Inc.. |
| |
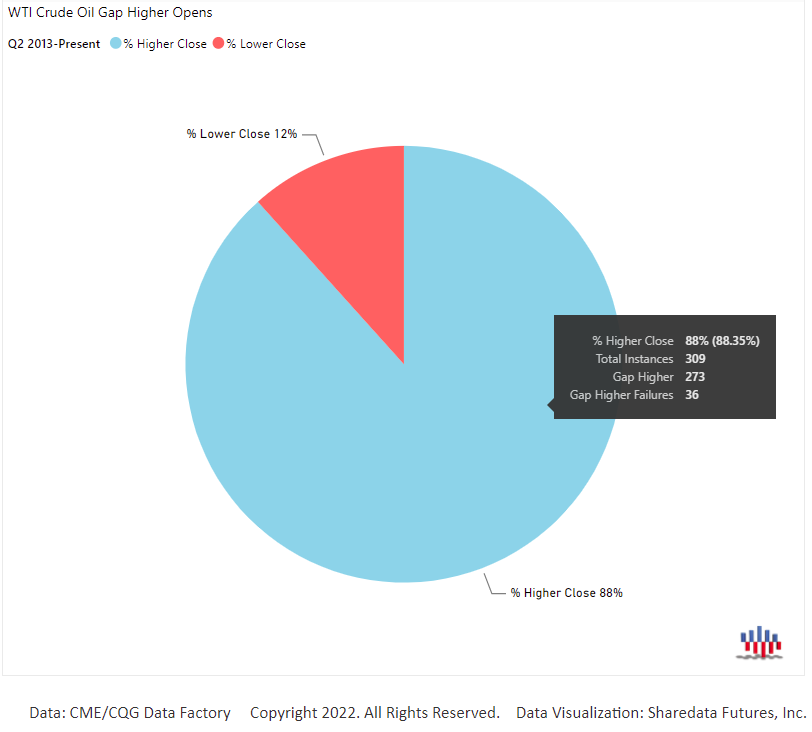
| Gap Higher Opens are defined in this context as auctions which open beyond the prior day's NY high. In days before full electronic trading, this period would have been referred to as the "Pit Session". For simplicity, it can be thought of today as the period of the generally highest volume activity (the NY auction in the case of WTI Crude futures). From a structural perspective, Gaps indicate an imbalance in market positioning and bias. When statistical analysis is done of WTI Gap Higher Opens, the data reveals important insights. Based on a dataset going back to Q2 2013, it can be observed that in 309 instances of Gap Higher Opens in WTI Crude, the market has closed higher from that NY open 88% of the time. |
|
| Figure 2. WTI Gap Higher Opens. |
| Graphic provided by: Sharedata Futures, Inc.. |
| |
| Further, when the Gap Higher Opens held, the average NY auction range amplitude is 131 ticks. These data points provide several key insights: 1) Statistically, there is asymmetric potential for higher prices (within the intraday context) in the event of a Gap Higher Open in WTI Crude. This indicates that despite significantly higher prices in the near-term, there is no statistical advantage to trading against those higher prices, barring an offsetting structural formation such as sell excess (visible in the market profile). 2) The average range the NY auction after such structures is 131 ticks; a satisfactory range potential from which to seek profit. |

|
| Figure 3. WTI Gap Higher Open Ranges. |
| Graphic provided by: Sharedata Futures, Inc.. |
| |
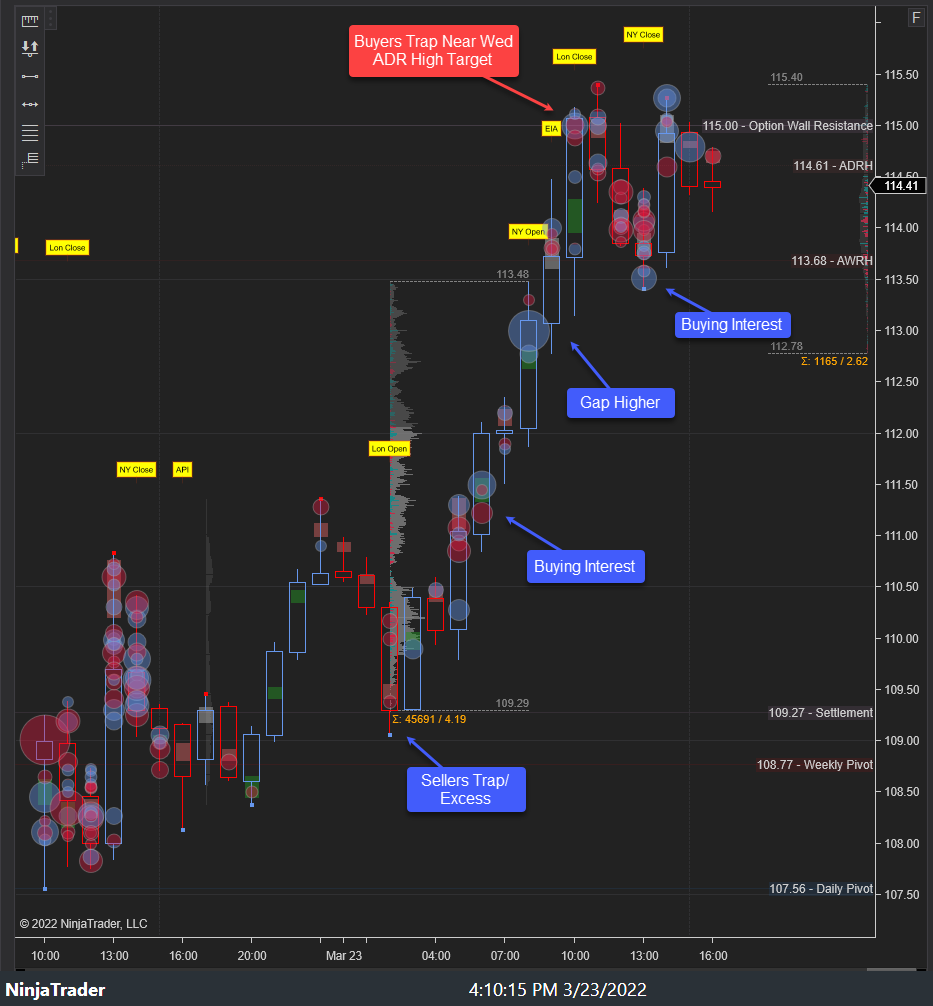
| Following the Globex buy excess formation above daily key support (107.56s), the market traded higher to 113.48s where additional buying interest emerged as the Gap Higher formed into the NY open. Buying interest emerged early in NY trade. This was real-time structural and order flow data to confirm the Gap Higher Open. Price discovery higher then continued to 115.40s near Wed's ADR High target before buyers trapped amidst sell excess, halting the rally ahead of the NY close. The NY auction traded a range of 262 ticks (nearly double the 131-tick average). |
|
| Figure 4. WTI Daily Auction 23 Mar 2022. |
| Graphic provided by: NinjaTrader. |
| |
| In this analysis, the significance of the Gap Higher Open was identified. It was shown that Gap Higher Opens in WTI Crude provide both asymmetric potential for trend continuation and actionable range amplitude. These structural formations can be confirmed or negated with the use of real-time analysis of market structure via the Market Profile and order flow data. This confluence of structural, statistical, and order flow data provided insight into the auction's outcome based not on lagging fundamental data or media hype, but rather, the structural formation and transactional behavior of significant quantity that drives price discovery. |
Sharedata Futures, Inc. provides historical data mining and visualization for the benchmark NYMEX Energy Futures Markets.
Sharedata combines structural analysis of the market generated data, dynamic systems analysis, and Bayesian causal inference techniques favored by the scientific and intelligence communities to provide a robust framework for addressing the uncertainty and risk in energy pricing.
| Title: | Founder |
| Company: | Sharedata Futures, Inc. |
| Dallas, TX | |
| Website: | www.sdfanalytics.com |
| E-mail address: | support@sdfanalytics.com |
Traders' Resource Links | |
| Sharedata Futures, Inc. has not added any product or service information to TRADERS' RESOURCE. | |
Click here for more information about our publications!
PRINT THIS ARTICLE

Request Information From Our Sponsors
- StockCharts.com, Inc.
- Candle Patterns
- Candlestick Charting Explained
- Intermarket Technical Analysis
- John Murphy on Chart Analysis
- John Murphy's Chart Pattern Recognition
- John Murphy's Market Message
- MurphyExplainsMarketAnalysis-Intermarket Analysis
- MurphyExplainsMarketAnalysis-Visual Analysis
- StockCharts.com
- Technical Analysis of the Financial Markets
- The Visual Investor
- VectorVest, Inc.
- Executive Premier Workshop
- One-Day Options Course
- OptionsPro
- Retirement Income Workshop
- Sure-Fire Trading Systems (VectorVest, Inc.)
- Trading as a Business Workshop
- VectorVest 7 EOD
- VectorVest 7 RealTime/IntraDay
- VectorVest AutoTester
- VectorVest Educational Services
- VectorVest OnLine
- VectorVest Options Analyzer
- VectorVest ProGraphics v6.0
- VectorVest ProTrader 7
- VectorVest RealTime Derby Tool
- VectorVest Simulator
- VectorVest Variator
- VectorVest Watchdog