

HOT TOPICS LIST
- MACD
- Fibonacci
- RSI
- Gann
- ADXR
- Stochastics
- Volume
- Triangles
- Futures
- Cycles
- Volatility
- ZIGZAG
- MESA
- Retracement
- Aroon
INDICATORS LIST
LIST OF TOPICS
PRINT THIS ARTICLE
by Taylor Ireland
In this article, we examine the rally toward the Average Daily Range High target on Wednesday, April 13, 2022. Market structure and order flow provide insight into the market's dual-auction price discovery process. Analysis of this data provides a structural and statistical framework of these market structures, informing one's risk management process.
Position: N/A
Taylor Ireland
Sharedata Futures, Inc. provides historical data mining and visualization for the benchmark NYMEX Energy Futures Markets.
Sharedata combines structural analysis of the market generated data, dynamic systems analysis, and Bayesian causal inference techniques favored by the scientific and intelligence communities to provide a robust framework for addressing the uncertainty and risk in energy pricing.
PRINT THIS ARTICLE
ENERGY
Buy Excess Signaled Trend Higher To Daily Statistical Resistance
05/12/22 04:24:16 PMby Taylor Ireland
In this article, we examine the rally toward the Average Daily Range High target on Wednesday, April 13, 2022. Market structure and order flow provide insight into the market's dual-auction price discovery process. Analysis of this data provides a structural and statistical framework of these market structures, informing one's risk management process.
Position: N/A
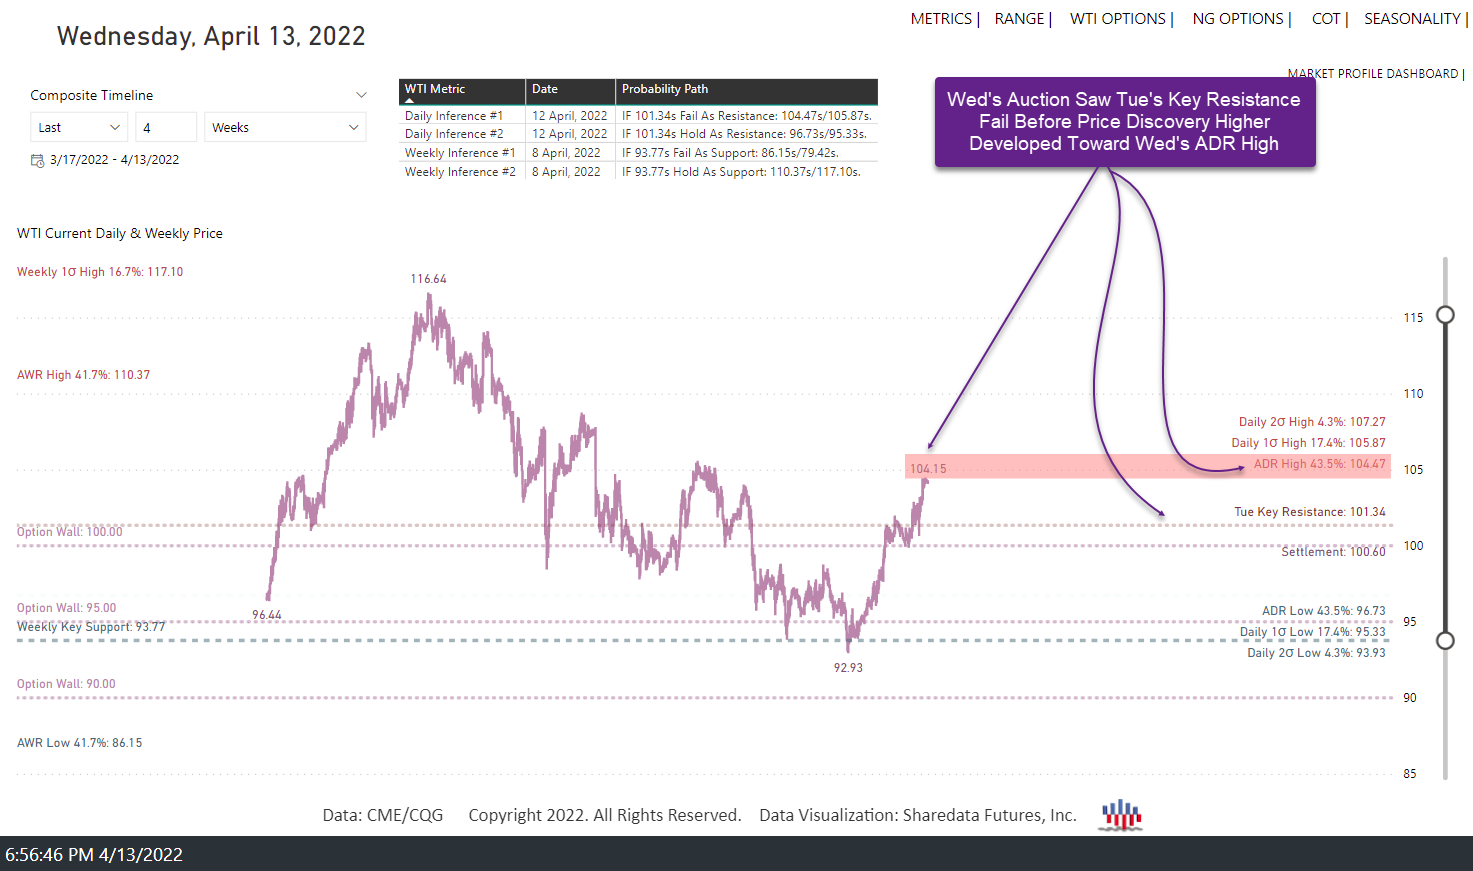
| April 13 2022: The primary expectation in Sharedata's Energy Daily Dashboard for Wednesday 13 April 2022's auction was for price discovery higher. Our daily dual probability path assigned the primary expectation for price discovery higher, noting statistical resistance targets were: 104.47s/105.87s/107.27s, respectively. Qualitatively, these levels had held as resistance 66%, 87%, and 96% of recent market auctions, respectively, based on the market generated data. This data provided a buy-side framework with a probable resistance "zone" between 104.47s-105.87s. This type of daily framework, while useful, is more effective when used with structural analysis (in the form of the Market Profile) to confirm or negate the most probable daily inference. In this case, daily key resistance failed in Wednesday's Globex auction before buy excess formed early in NY trade upon the re-test of the resistance. Price discovery higher then ensued to 104.47s at Wed's ADR high target into the NY close. |
|
| Figure 1. Energy Daily Dashboard 13 Apr 2022. |
| Graphic provided by: Sharedata Futures, Inc.. |
| |
| Heading into Wednesday's auction a minor Globex pullback developed to 99.88s where sellers trapped, halting the downward movement. A breakout attempt above daily key resistance developed to 102.89s where sell excess formed ahead of the NY open. A pullback to test the breakout developed early in NY trade where buy excess formed, confirming the breakout. Price discovery higher then continued to 104.47s at/near Wed's ADR High Target into the NY close. |
|
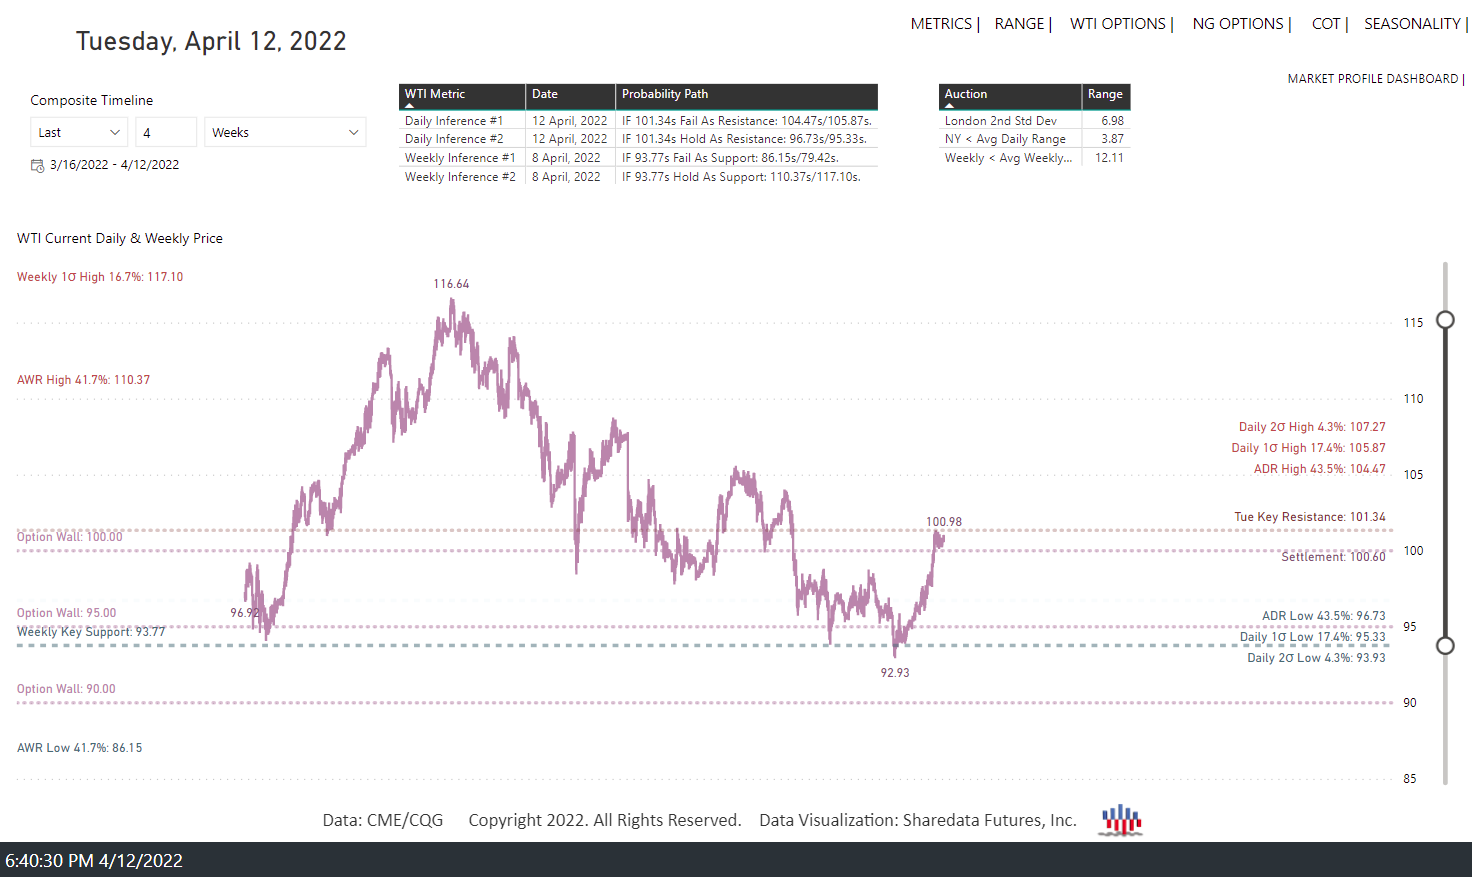
| Figure 2. Energy Daily Dashboard 12 Apr 2022. |
| Graphic provided by: Sharedata Futures, Inc.. |
| |
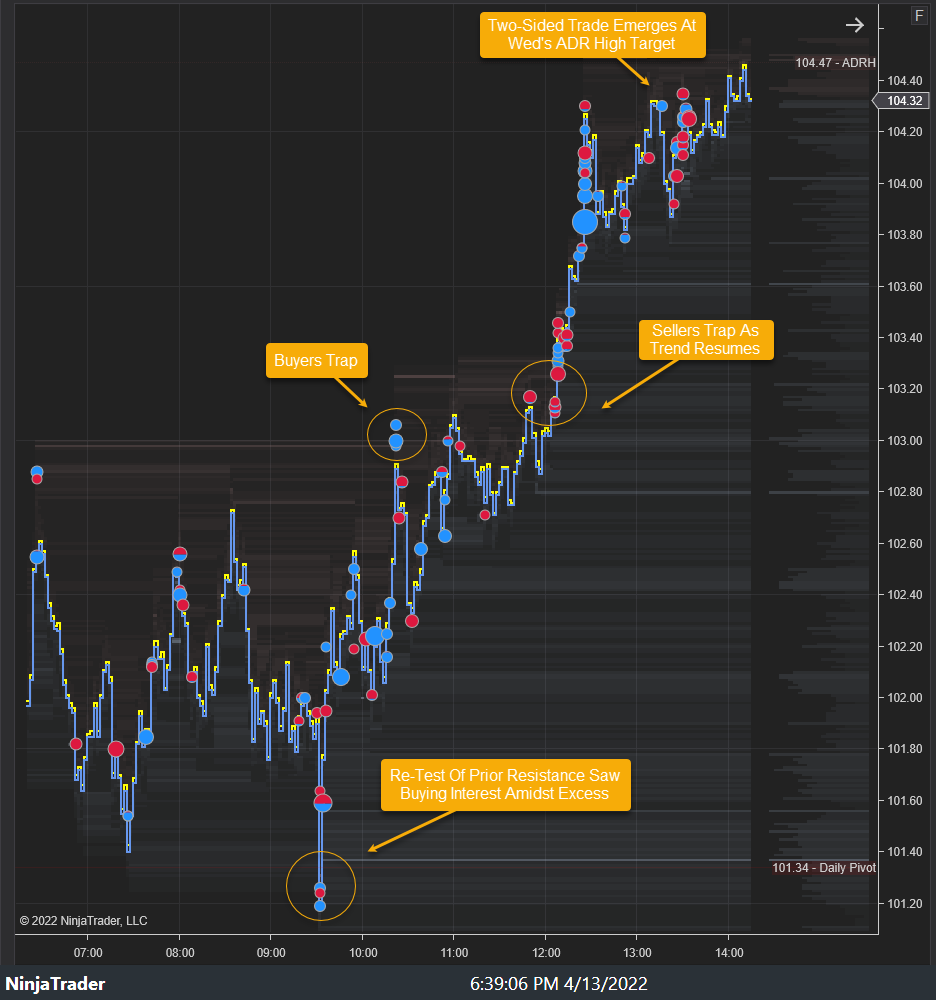
| The practice of analyzing market structure development is best accomplished with the use of order flow and limit order book (LOB) analysis. In short, plotting the buy and sell transactions of significance (in this case volume equal to or greater than 75 contracts) as well as the resting limit bids and offers allows us to see both the actions and intent of larger participants (who significantly affect price). |
|
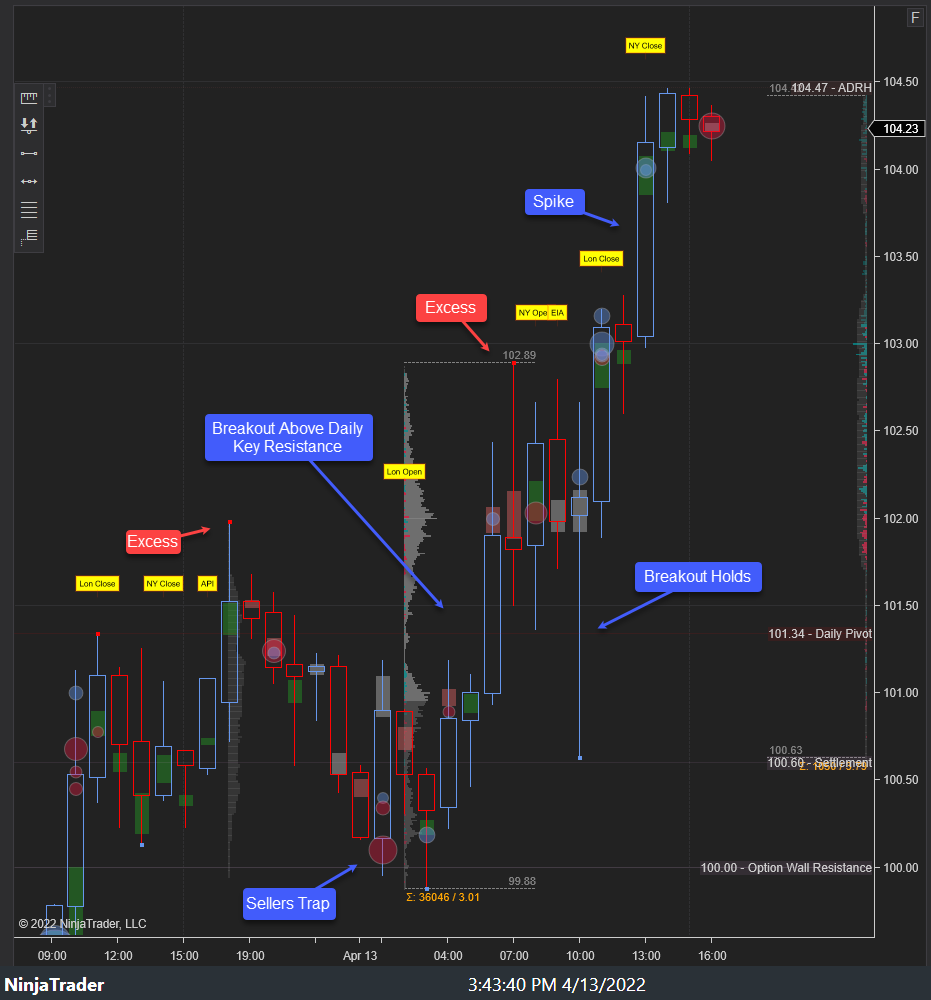
| Figure 3. WTI Auction 13 Apr 2022. |
| Graphic provided by: NinjaTrader. |
| |
| Following the Globex breakout above daily key resistance, the market pulled back early in NY trade to test the level. Buying interest emerged there amidst a structural buy excess as the breakout held, and price discovery higher ensued. This was real-time structural and order flow data to confirm the breakout. Sellers then trapped at the intra-day high before price discovery higher continued toward Wed's ADR High target into the NY close. |
|
| Figure 4. WTI Limit Order Book 13 Apr 2022. |
| Graphic provided by: NinjaTrader. |
| |
| In this analysis, the primary daily expectation of a rally was confirmed as a confluence of bullish order flow and market structure (buy excess) developed early in NY trade. This confluence of structural, statistical, and order flow data provided insight into the auction's outcome based not on lagging fundamental data or media hype, but rather, the structural formation and transactional behavior of significant quantity that drives price discovery. |
Sharedata Futures, Inc. provides historical data mining and visualization for the benchmark NYMEX Energy Futures Markets.
Sharedata combines structural analysis of the market generated data, dynamic systems analysis, and Bayesian causal inference techniques favored by the scientific and intelligence communities to provide a robust framework for addressing the uncertainty and risk in energy pricing.
| Title: | Founder |
| Company: | Sharedata Futures, Inc. |
| Dallas, TX | |
| Website: | www.sdfanalytics.com |
| E-mail address: | support@sdfanalytics.com |
Traders' Resource Links | |
| Sharedata Futures, Inc. has not added any product or service information to TRADERS' RESOURCE. | |
Click here for more information about our publications!
PRINT THIS ARTICLE

Request Information From Our Sponsors
- VectorVest, Inc.
- Executive Premier Workshop
- One-Day Options Course
- OptionsPro
- Retirement Income Workshop
- Sure-Fire Trading Systems (VectorVest, Inc.)
- Trading as a Business Workshop
- VectorVest 7 EOD
- VectorVest 7 RealTime/IntraDay
- VectorVest AutoTester
- VectorVest Educational Services
- VectorVest OnLine
- VectorVest Options Analyzer
- VectorVest ProGraphics v6.0
- VectorVest ProTrader 7
- VectorVest RealTime Derby Tool
- VectorVest Simulator
- VectorVest Variator
- VectorVest Watchdog
- StockCharts.com, Inc.
- Candle Patterns
- Candlestick Charting Explained
- Intermarket Technical Analysis
- John Murphy on Chart Analysis
- John Murphy's Chart Pattern Recognition
- John Murphy's Market Message
- MurphyExplainsMarketAnalysis-Intermarket Analysis
- MurphyExplainsMarketAnalysis-Visual Analysis
- StockCharts.com
- Technical Analysis of the Financial Markets
- The Visual Investor