

HOT TOPICS LIST
- MACD
- Fibonacci
- RSI
- Gann
- ADXR
- Stochastics
- Volume
- Triangles
- Futures
- Cycles
- Volatility
- ZIGZAG
- MESA
- Retracement
- Aroon
INDICATORS LIST
LIST OF TOPICS
PRINT THIS ARTICLE
by Stella Osoba, CMT
Just like the German proverb co-opted by finance which says that trees don't grow to the sky, so also can we assume that roots don't burrow all the way to the center of the earth? If one were to dig deep enough, we could probably pull out of the earth even the deepest of roots. So when we look at stocks which have been in a steady decline we know that eventually most downtrends will end.
Position: N/A
Stella Osoba, CMT
Stella Osoba is a trader and financial writer. She is a frequent contributor to "Technical Analysis of Stocks and Commodities" magazine and "Traders.com Advantage" as well as other financial publications.
PRINT THIS ARTICLE
TECHNICAL ANALYSIS
Are We There Yet?
05/12/22 04:20:27 PMby Stella Osoba, CMT
Just like the German proverb co-opted by finance which says that trees don't grow to the sky, so also can we assume that roots don't burrow all the way to the center of the earth? If one were to dig deep enough, we could probably pull out of the earth even the deepest of roots. So when we look at stocks which have been in a steady decline we know that eventually most downtrends will end.
Position: N/A
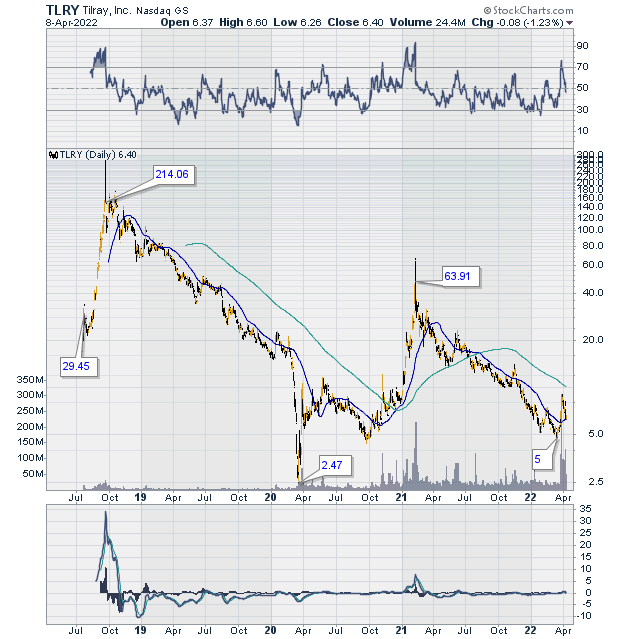
| Tilray Brands, Inc. (TLRY) is a global cannabis lifestyle consumer packaged goods company. When it began trading on the Nasdaq on July 19, 2018, it closed at 22.39. Exuberance soon engulfed the stock and its price ran up to a frothy high of 300.00 on September 19, 2018, merely two months later. From those lofty highs, price began a nasty descent (See Figure 1). |
|
| Figure 1. TLRY Daily Chart (2019-2022). |
| Graphic provided by: StockCharts.com. |
| |
| On March 18, 2020 price touched a low of 2.43 forming a V shaped bottom on the price chart and then began a rise to reach a lower high of 67.00 on February 10, 2021. The descent from that second high culminated in a double bottom with price dropping to a higher low of 4.78 on March 2022. Price closed on April 8, 2022 at 6.40. |
| The most recent breakout happened on March 25, 2022 when a bullish candle with a long lower tail closed above the prior highs on strong volume (See Figure 2). However, price did not hold and proceeded to retreat over the next 10 trading days. The doji which formed on April 8, 2022 closed on the 50-day moving average. Will price revert back to the upside or continue lower from here? Hard to tell when there are conflicting signals. The deep reaction from the breakout could well be bearish especially as the bottom panel under the price chart shows the signal line crossing over the MACD line as both lines turn down. |

|
| Figure 2. TRLY Daily Chart (2022). |
| Graphic provided by: StockCharts.com. |
| |
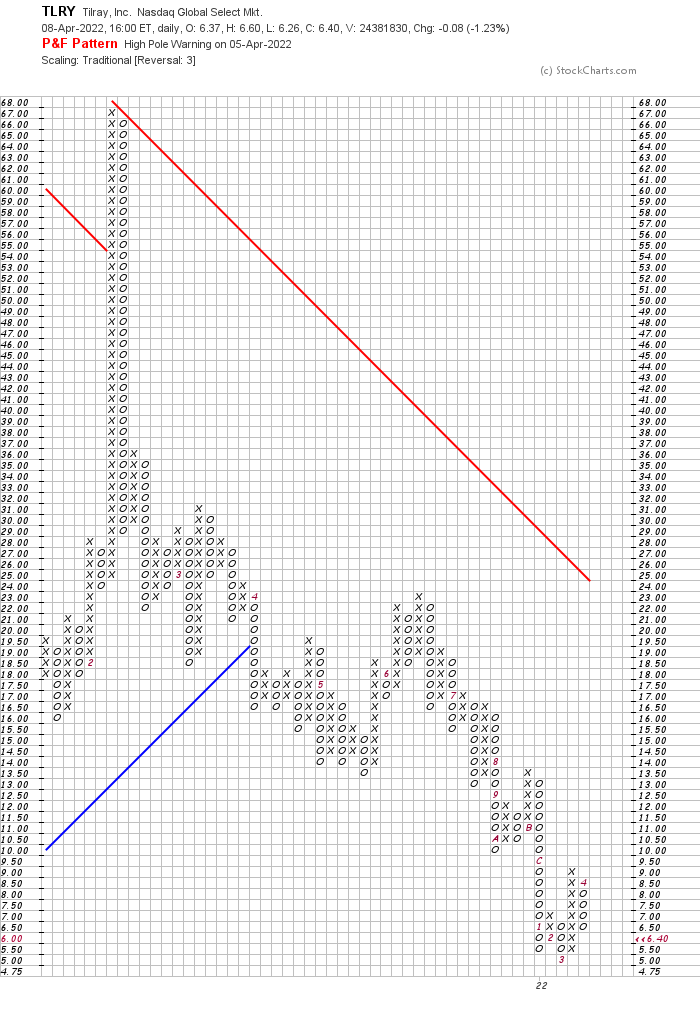
| Figure 3 is a point and figure chart which clearly shows TLRY's massive price decline. The current signal is a high pole warning which is a bearish warning. A high pole is an alert that selling pressure has caused price to give back at least 50% of its prior rise. To look for a buying signal it might be wise to watch the P&F chart to see if the resolution is in lower prices which will give off a double bottom breakdown signal when a second column of O's form one box below the prior column, or a double top breakout when a column of X's break one box above the prior column of X's. |
|
| Figure 3. TRLY P&F Chart. |
| Graphic provided by: StockCharts.com. |
| |
| Self restraint is a much underrated trading virtue. It is wise to remember that being impatient can be costly. So wait and watch, price will tell you what it intends to do and give the patient trader enough time to enter the trade when the time is right, or to avoid it altogether if the price never acts right. |
Stella Osoba is a trader and financial writer. She is a frequent contributor to "Technical Analysis of Stocks and Commodities" magazine and "Traders.com Advantage" as well as other financial publications.
| E-mail address: | stellaosoba@gmail.com |
Click here for more information about our publications!
Comments

Request Information From Our Sponsors
- StockCharts.com, Inc.
- Candle Patterns
- Candlestick Charting Explained
- Intermarket Technical Analysis
- John Murphy on Chart Analysis
- John Murphy's Chart Pattern Recognition
- John Murphy's Market Message
- MurphyExplainsMarketAnalysis-Intermarket Analysis
- MurphyExplainsMarketAnalysis-Visual Analysis
- StockCharts.com
- Technical Analysis of the Financial Markets
- The Visual Investor
- VectorVest, Inc.
- Executive Premier Workshop
- One-Day Options Course
- OptionsPro
- Retirement Income Workshop
- Sure-Fire Trading Systems (VectorVest, Inc.)
- Trading as a Business Workshop
- VectorVest 7 EOD
- VectorVest 7 RealTime/IntraDay
- VectorVest AutoTester
- VectorVest Educational Services
- VectorVest OnLine
- VectorVest Options Analyzer
- VectorVest ProGraphics v6.0
- VectorVest ProTrader 7
- VectorVest RealTime Derby Tool
- VectorVest Simulator
- VectorVest Variator
- VectorVest Watchdog