

HOT TOPICS LIST
- MACD
- Fibonacci
- RSI
- Gann
- ADXR
- Stochastics
- Volume
- Triangles
- Futures
- Cycles
- Volatility
- ZIGZAG
- MESA
- Retracement
- Aroon
INDICATORS LIST
LIST OF TOPICS
PRINT THIS ARTICLE
by Stella Osoba, CMT
One of the common point and figure signals is the double top breakout. This is when a column of X's break above a prior column of X's separated by a middle column of O's.
This short article shows how to spot this signal and some ways to incorporate it into your trading.
Position: N/A
Stella Osoba, CMT
Stella Osoba is a trader and financial writer. She is a frequent contributor to "Technical Analysis of Stocks and Commodities" magazine and "Traders.com Advantage" as well as other financial publications.
PRINT THIS ARTICLE
TECHNICAL ANALYSIS
Trading Double Top Breakouts
04/15/22 01:41:45 PMby Stella Osoba, CMT
One of the common point and figure signals is the double top breakout. This is when a column of X's break above a prior column of X's separated by a middle column of O's.
This short article shows how to spot this signal and some ways to incorporate it into your trading.
Position: N/A
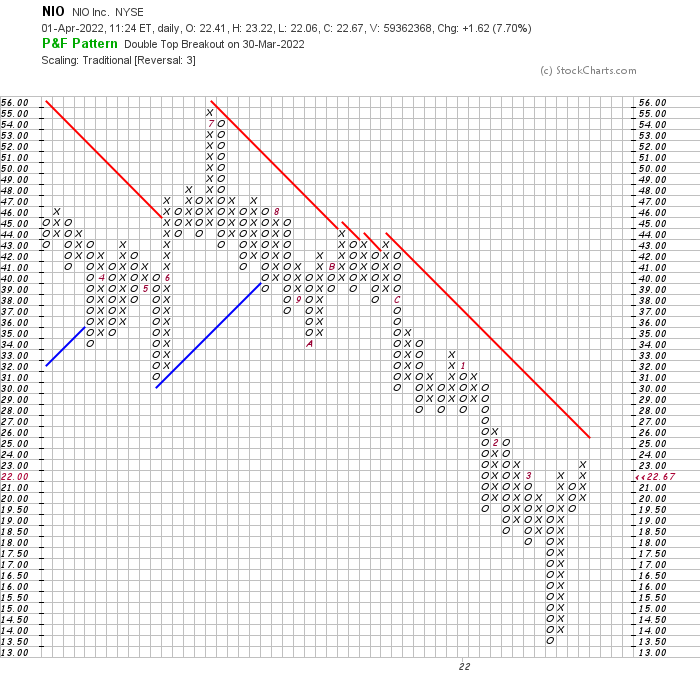
| Using bar charts, candlestick charts and line charts are often essential in looking for trading signals, but understanding Point and Figure charts and learning how to read the signals gives one an added advantage. P&F signals are clear, easy to spot and often they provide additional information. To illustrate the double top breakout, we will use the P&F chart of NIO. |
| NIO Inc. (NIO) is a Chinese based holding company whose main line of business is the design, development, manufacture and sales of high-end electric vehicles. On March 30, 2022, its P&F chart formed a double top breakout. On that day, price reached a high of 23.86 and closed at 22.17. The trigger for the P&F signal was when price rose above 23 (See Figure 1). |
|
| Figure 1. P&F chart for NIO. |
| Graphic provided by: StockCharts.com. |
| |
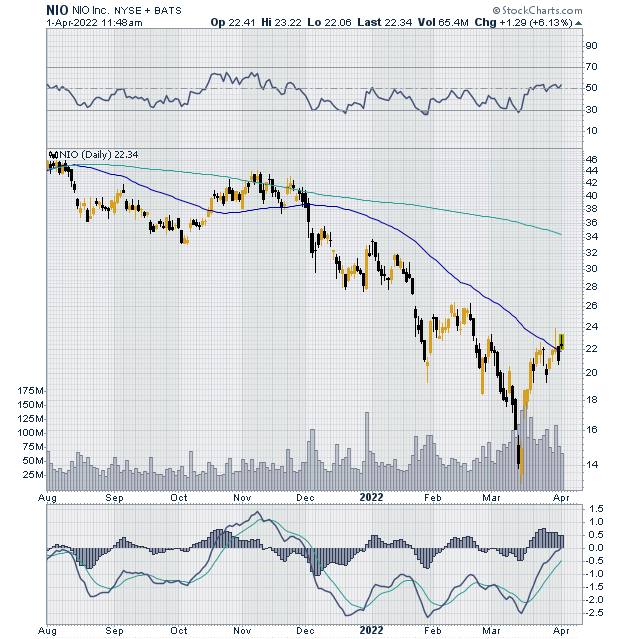
| The daily candle stick chart (See Figure 2) shows that price is likely in the process of a reversal from the downtrend which began in January 2021 when price reached a high of 66.99. The candlestick chart shows that within NIO's V shaped reversal, it also formed an Island Reversal and proceeded to move higher, breaking above its 50 day moving average. Both the MACD and the RSI show positive divergence with the signal line crossing above the MACD line. Panels are above and below the price chart show the RSI and MACD indicators respectively. |
|
| Figure 2. Daily chart for NIO. |
| Graphic provided by: StockCharts.com. |
| |
| The question then becomes when to enter a bullish trade. Some traders will take all signals formed by P&F which is an acceptable way to trade the signals. But remember that if trading in this manner all signals must be taken. So if as is often the case, a whiplash develops then the opposing signal must be taken. A whiplash in this case would be a double bottom breakdown being the next signal to develop. This would happen if a column of O's forms when price breaks below 19. |
| The more cautious trader may wish to wait for price to break above 23 and to remain there for sometime, to confirm that price has the staying power to sustain this level. Either way is valid, depending only on the risk tolerance and skill of the individual trader. Never be too hasty to enter a trade. Only take signals you are comfortable with. |
Stella Osoba is a trader and financial writer. She is a frequent contributor to "Technical Analysis of Stocks and Commodities" magazine and "Traders.com Advantage" as well as other financial publications.
| E-mail address: | stellaosoba@gmail.com |
Click here for more information about our publications!
PRINT THIS ARTICLE

Request Information From Our Sponsors
- StockCharts.com, Inc.
- Candle Patterns
- Candlestick Charting Explained
- Intermarket Technical Analysis
- John Murphy on Chart Analysis
- John Murphy's Chart Pattern Recognition
- John Murphy's Market Message
- MurphyExplainsMarketAnalysis-Intermarket Analysis
- MurphyExplainsMarketAnalysis-Visual Analysis
- StockCharts.com
- Technical Analysis of the Financial Markets
- The Visual Investor
- VectorVest, Inc.
- Executive Premier Workshop
- One-Day Options Course
- OptionsPro
- Retirement Income Workshop
- Sure-Fire Trading Systems (VectorVest, Inc.)
- Trading as a Business Workshop
- VectorVest 7 EOD
- VectorVest 7 RealTime/IntraDay
- VectorVest AutoTester
- VectorVest Educational Services
- VectorVest OnLine
- VectorVest Options Analyzer
- VectorVest ProGraphics v6.0
- VectorVest ProTrader 7
- VectorVest RealTime Derby Tool
- VectorVest Simulator
- VectorVest Variator
- VectorVest Watchdog