HOT TOPICS LIST
- MACD
- Fibonacci
- RSI
- Gann
- ADXR
- Stochastics
- Volume
- Triangles
- Futures
- Cycles
- Volatility
- ZIGZAG
- MESA
- Retracement
- Aroon
INDICATORS LIST
LIST OF TOPICS
PRINT THIS ARTICLE
by Mark Rivest
How to find support and resistance using Point & Figure charts.
Position: N/A
Mark Rivest
Independent investment advisor, trader and writer. He has written articles for Technical Analysis of Stocks & Commodities, Traders.com Advantage,Futuresmag.com and, Finance Magnates. Author of website Four Dimension Trading.
PRINT THIS ARTICLE
POINT & FIGURE
Point & Figure Analysis Of The S&P 500
03/21/22 02:58:49 PMby Mark Rivest
How to find support and resistance using Point & Figure charts.
Position: N/A
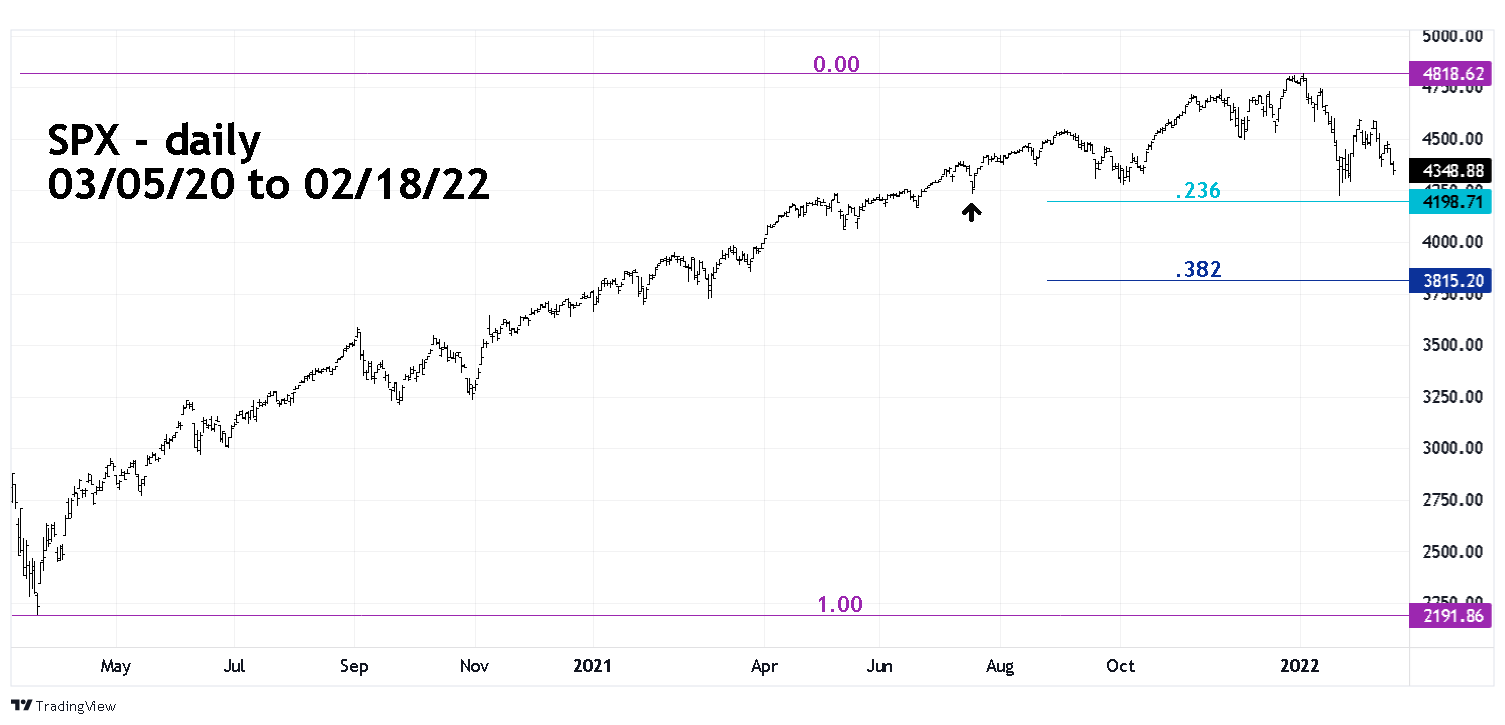
| Identifying market tops/bottoms is the most basic method for discovering support/resistance points. Frequently, a market will bottom, then rally and decline back to the prior bottom, a 100% retracement. Returns to prior tops/bottoms is an example of a Fibonacci retracement. Equality or a ratio of 1/1 is a Fibonacci retracement ratio. Other Fibonacci ratios are 34/55 = .618, 21/55 = .382, and 13/55 = .236. Sometimes markets can top or bottom outside of a Fibonacci retracement level; in those instances Point & Figure charts could help. S&P 500 - Daily When using Fibonacci analysis on bull moves begin by discovering the most significant bottom. For the S&P 500 (SPX) that's the crash bottom made on 03/23/20 at 2191.86. Please see the daily SPX chart illustrated in Figure 1. The subsequent bull market continued until 01/04/22 at SPX 4818.62. A .236 retracement of the bull market is at 4198.78. There's chart support on the 07/19/21 bottom at 4233..13. The SPX bottom made on 01/24/22 was at 4222.62, in the Fibonacci support zone of 4198.78 to 4233.13. If the .236 level is broken, the next Fibonacci support level is a .382 retrace of the bull move since March 2020 at SPX 3815.20. |

|
| Figure 1. When using Fibonacci analysis on bull moves begin by discovering the most significant bottom. |
| Graphic provided by: TradingView. |
| |
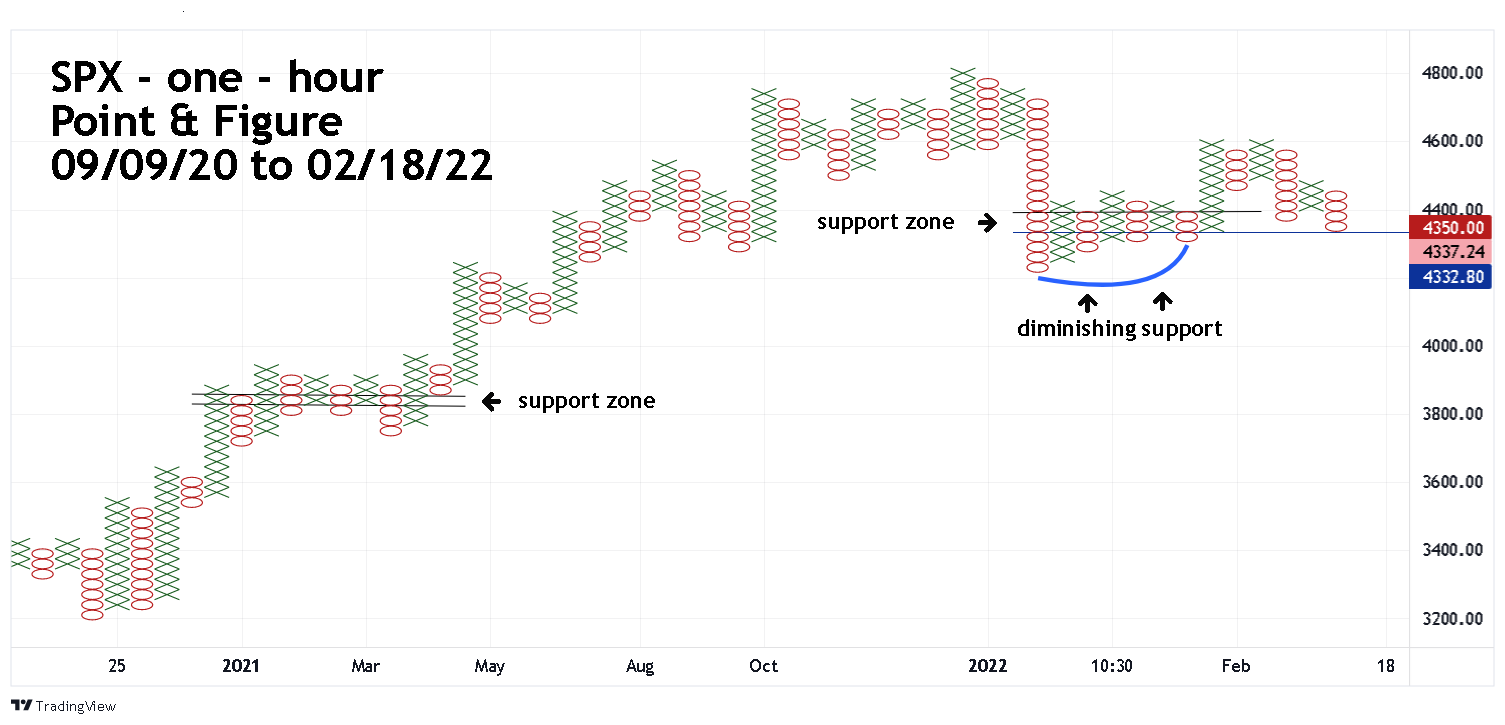
| S&P 500 - Hourly A Point-and-Figure chart plots price movements without taking into consideration the passage of time. P&F charts utilize columns consisting of stacked X's or O's, each of which represents a set amount of price movement. The X's illustrate rising prices, while O's represent a falling price.Please see the hourly SPX Point & Figure chart illustrated in Figure 2. Because Point & Figure charts don't take in the consideration of time, the price action is condensed. When analyzing daily movements use lower time scale charts. In this instance the one-hour chart is effective in discovering support/resistance. Note that at the SPX 01/24/22 bottom Point & Figure analysis would not have been effective because the bottom was not made in the area of a price cluster. However, the price action immediately after the 01/24/22 bottom has formed a distinctive price cluster. Note that a two-row price cluster composed of eight columns between approximately SPX 4395 and 4335 is a potential support level. As of 02/18/22 price has found support at the lower boundary of the cluster. If the support holds the subsequent rally could retrace back to the high made on 01/04/22. Below the lower boundary level there are diminishing levels of support. First a six-column row, followed by three, two and one column rows. The number of columns represents strength. If a nine-column row can't support price, its logical to expect a three- column row to be less effective in stopping a price drop. If the 01/24/22 bottom is broken it opens the door for a drop down to the next long column row. That potential support zone is a nine-column row with a lower boundary at 3828, near the .382 Fibonacci retracement level at 3815.20. |

|
| Figure 2. A Point-and-Figure chart plots price movements without taking into consideration the passage of time. |
| Graphic provided by: TradingView. |
| |
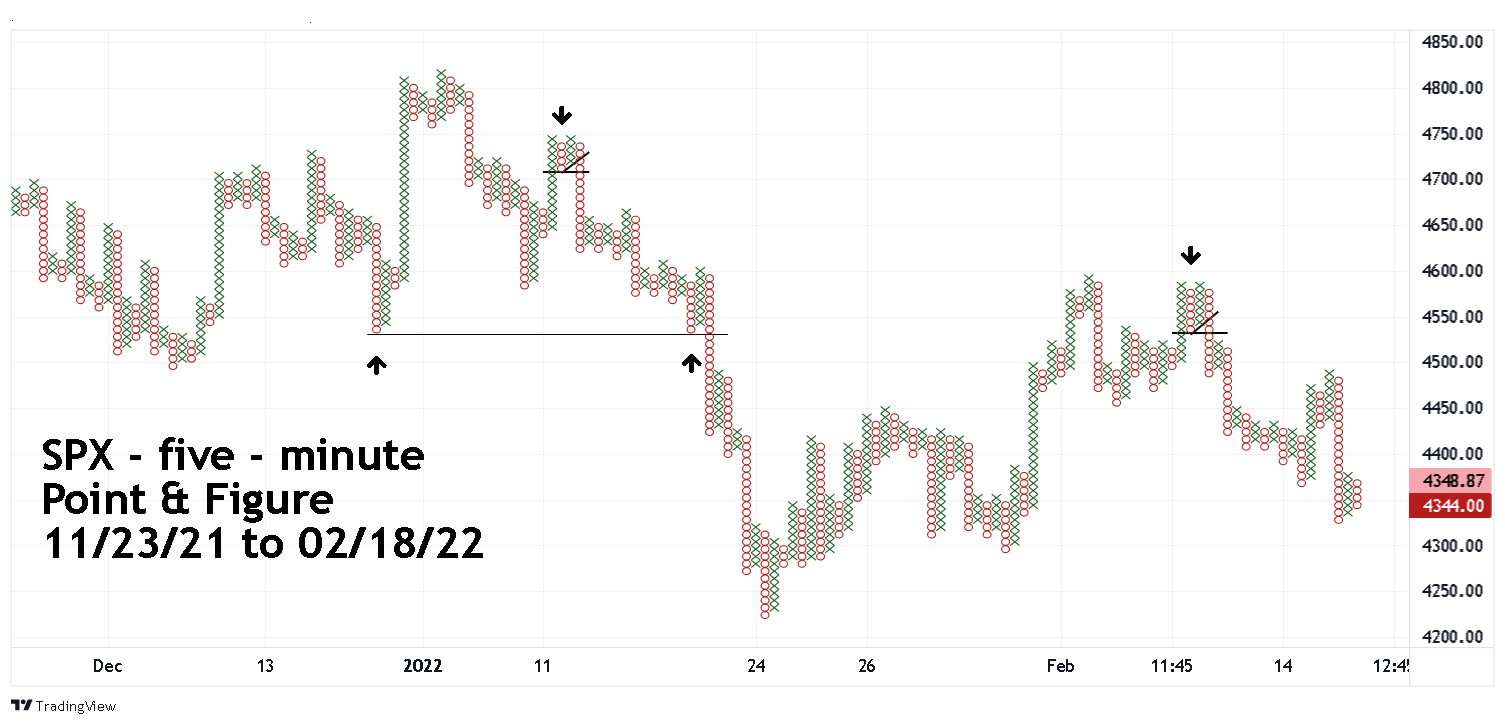
| S&P 500 - 5-Minute Examining time scales lower than hourly could reveal additional signals. Please see the 5-minute SPX Point & Figure chart. Double tops/bottoms could be difficult to trade. Should you exit a position or hold and add on to the position on a break of the double top/bottom? A safer tactic is to wait for confirmation. There was a double top formed on 01/11/22 and 01/13/22. First there was a break below the rising trendline. Then there was a break below the prior lowest "O" designation. That second break is the signal to either reverse long positions and go short, or if flat initiate a short position. There was another double top made on 02/08/22 and 02/10/22. This was a more difficult situation to analyze because of price support just below the break down point. Note that after the two downside breaks - price declined into an area of two rows of seven columns support. In this situation the bears were able to overcome the support. This is not always the case. When shorting after double tops or buying after double bottom be aware of nearby support/resistance. The other type of double bottoms is illustrated by the bottoms made on 12/17/21 and 01/19/22; note there's a lot of space between these two bottoms. In this situation wait for the next rally, if it's reversed go short or exit long positions on a break below the double bottom. |

|
| Figure 3. Examining time scales lower than hourly could reveal additional signals. |
| Graphic provided by: TradingView. |
| |
| Combining the Methodologies Discovering support/resistance is one of the most important factors in trading. The combination of Fibonacci analysis with Point & Figure charts could be helpful in reducing losses and increasing profits. Further Reading: Shah Prashant (2018) "Trading the Markets the Point & Figure Way" Notion Press. Frost A.J and Robert Prechter (1985) "Elliott Wave Principle", New Classics Library. |
Independent investment advisor, trader and writer. He has written articles for Technical Analysis of Stocks & Commodities, Traders.com Advantage,Futuresmag.com and, Finance Magnates. Author of website Four Dimension Trading.
| Website: | www.fourdimensiontrading.com |
| E-mail address: | markrivest@gmail.com |
Click here for more information about our publications!
Comments

Request Information From Our Sponsors
- StockCharts.com, Inc.
- Candle Patterns
- Candlestick Charting Explained
- Intermarket Technical Analysis
- John Murphy on Chart Analysis
- John Murphy's Chart Pattern Recognition
- John Murphy's Market Message
- MurphyExplainsMarketAnalysis-Intermarket Analysis
- MurphyExplainsMarketAnalysis-Visual Analysis
- StockCharts.com
- Technical Analysis of the Financial Markets
- The Visual Investor
- VectorVest, Inc.
- Executive Premier Workshop
- One-Day Options Course
- OptionsPro
- Retirement Income Workshop
- Sure-Fire Trading Systems (VectorVest, Inc.)
- Trading as a Business Workshop
- VectorVest 7 EOD
- VectorVest 7 RealTime/IntraDay
- VectorVest AutoTester
- VectorVest Educational Services
- VectorVest OnLine
- VectorVest Options Analyzer
- VectorVest ProGraphics v6.0
- VectorVest ProTrader 7
- VectorVest RealTime Derby Tool
- VectorVest Simulator
- VectorVest Variator
- VectorVest Watchdog
