

HOT TOPICS LIST
- MACD
- Fibonacci
- RSI
- Gann
- ADXR
- Stochastics
- Volume
- Triangles
- Futures
- Cycles
- Volatility
- ZIGZAG
- MESA
- Retracement
- Aroon
INDICATORS LIST
LIST OF TOPICS
PRINT THIS ARTICLE
by Taylor Ireland
Analysis of derivatives informs a risk management process. Recent COT data reflected extreme bullish posture by leveraged participants. COT data and seasonality suggested a corrective phase was likely. In this article, we examine significant futures and options positioning along with historical seasonality driving WTI price action.
Position: N/A
Taylor Ireland
Sharedata Futures, Inc. provides historical data mining and visualization for the benchmark NYMEX Energy Futures Markets.
Sharedata combines structural analysis of the market generated data, dynamic systems analysis, and Bayesian causal inference techniques favored by the scientific and intelligence communities to provide a robust framework for addressing the uncertainty and risk in energy pricing.
PRINT THIS ARTICLE
DERIVATIVES
WTI's COT & Seasonal Trends Foreshadowed The Autumn High
02/03/22 04:29:27 PMby Taylor Ireland
Analysis of derivatives informs a risk management process. Recent COT data reflected extreme bullish posture by leveraged participants. COT data and seasonality suggested a corrective phase was likely. In this article, we examine significant futures and options positioning along with historical seasonality driving WTI price action.
Position: N/A
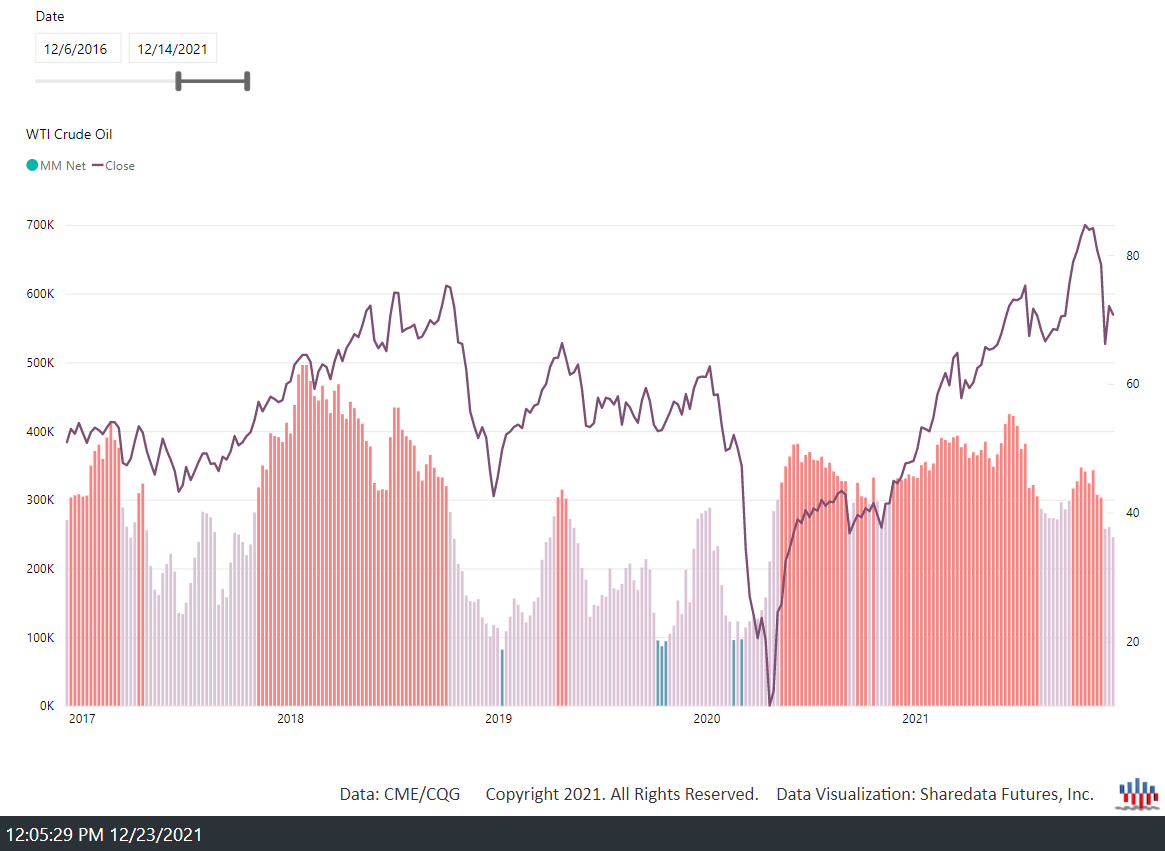
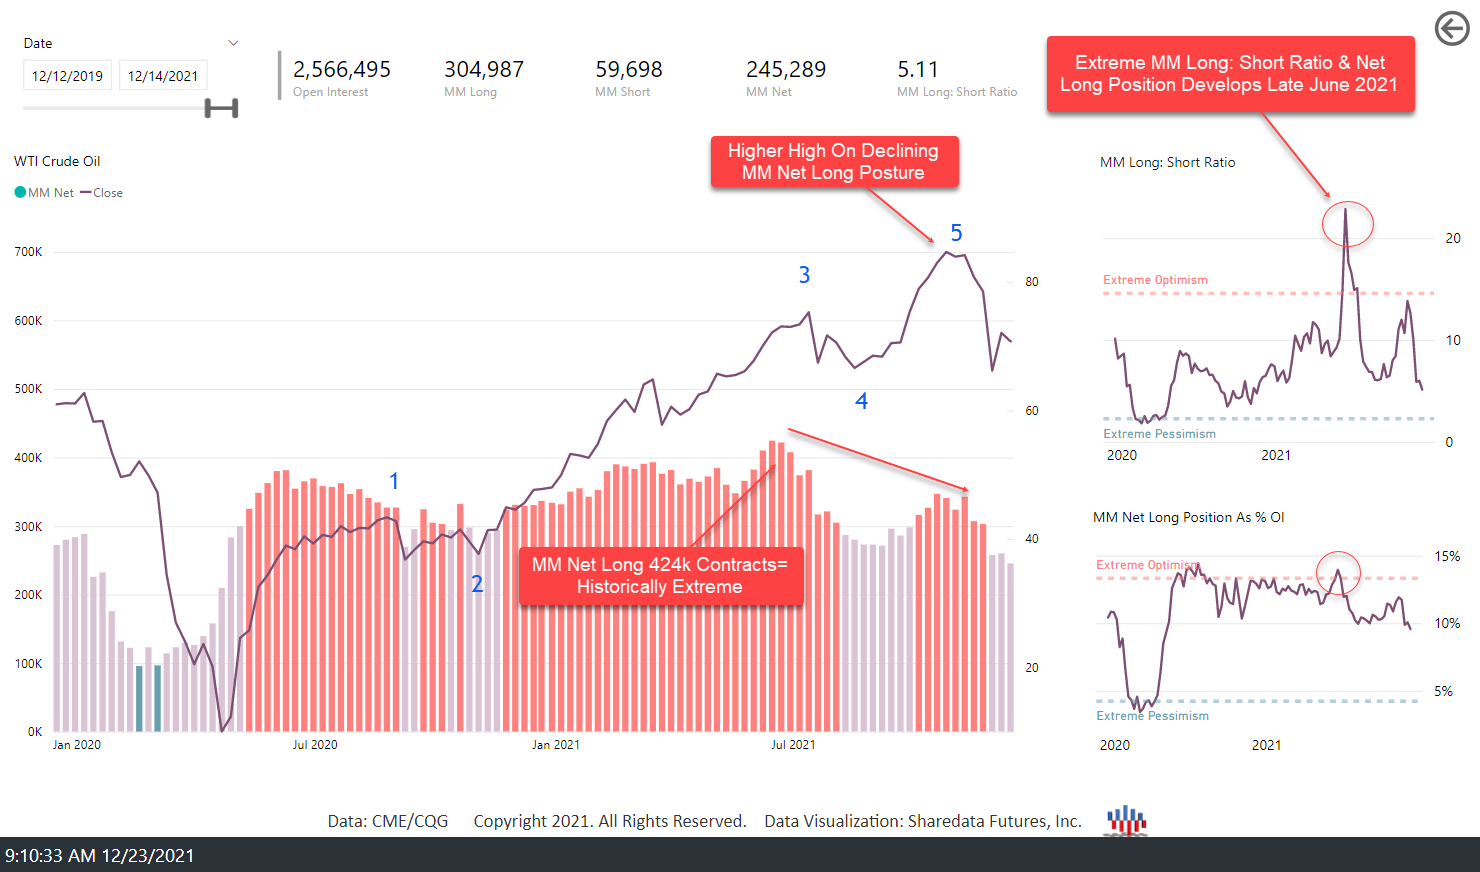
| Natural systems (of which financial markets are a part) grow in cycles of five waves and contract in cycles of three waves. This logic is part of fractal geometry and is applied historically in markets in what can be referred to as Elliott Wave Theory (named for chartist R.N Elliott). Based on this logic, we can plot a trend model from the secular low formed in April 2020. While open to multiple interpretations, this is our current primary expectation of WTI's current trend. The market currently appears to have completed its 5th expansionary wave higher begun following the March 2021 correction to 55.20s. When Commitment of Traders (COT) data is overlayed on this model, we can see more specifically the posture of large, leveraged participants known as Managed Money (MM) who can affect price in substantial ways. |

|
| Figure 1. WTI Price Fractal. |
| Graphic provided by: Sharedata Futures, Inc.. |
| |
| When compiling and plotting the historical MM COT data, it is evident that when MM's net posture reaches +300k contracts, meaningful corrections generally follow. These types of corrections occurred in 2017, 2018, and 2019-2020. Following the April 2020 "Covid" low, the market rallied into June 2021 toward the mid-$70s, where once again, the Managed Money net posture reached +424k contracts (424 million barrels in net length). This posture occurred with no material offsetting short position. |
|
| Figure 2. WTI Price & Managed Money Net Position. |
| Graphic provided by: Sharedata Futures, Inc.. |
| |
| From the positioning of leveraged capital and A completed 3rd wave expansion higher from $57.22s formed in early July near $76 as MM Net Posture reached +424k contracts (a historical extreme). Following the 4th wave corrective phase, the rally resumed into late October, completing a 5th wave higher near $85. This completed fractal pattern occurred as MM Net Long posture was declining into a seasonally bearish period. This leveraged capital posture and price divergence forewarned of a potential for lower prices ahead despite financial media hysteria around the prevailing inflation narrative and the usual calls for imminent $100 oil. Thereafter, the market declined approximately 27% toward 62s into early December before an initial support area formed. |
|
| Figure 3. WTI Price Fractal & Managed Money Net Position. |
| Graphic provided by: Sharedata Futures, Inc.. |
| |
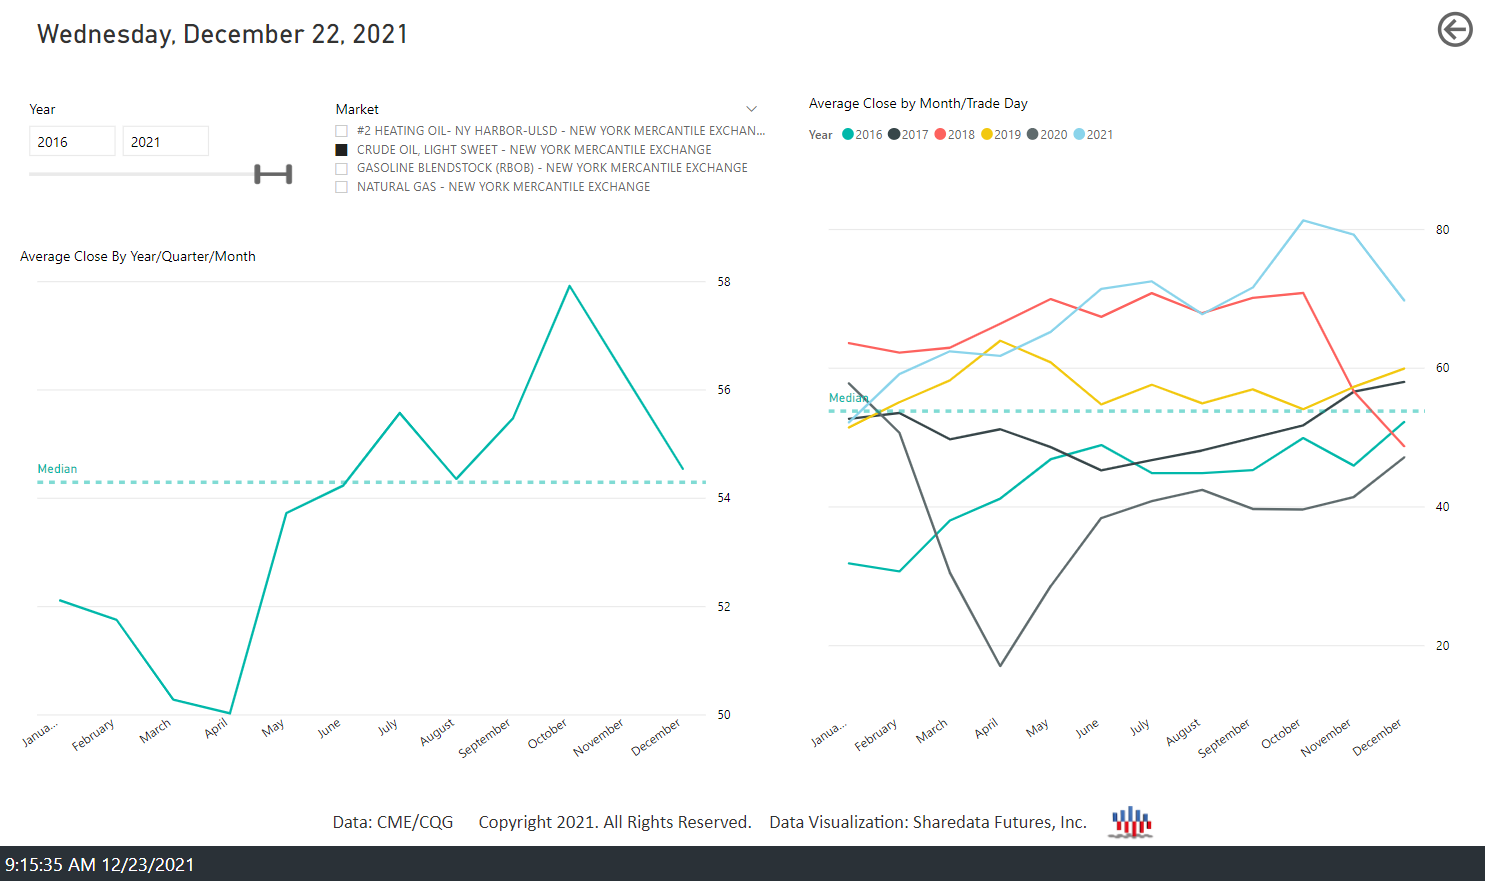
| Beyond the fractal pattern and MM posture, there was another market data point to provide key insight: seasonality. The graph below plots the seasonality of the WTI contract back to 1980. Here we see a 5-year view. WTI seasonality is neutral to bearish, on a historical basis, October- December, on 5/10/15/20Yr timeframes. Following the formation of the current price high in October 2021, WTI traded lower approximately 27% into early December 2021. This effect has served as an additional headwind to materially higher prices in WTI. |
|
| Figure 4. WTI Seasonality. |
| Graphic provided by: Sharedata Futures, Inc.. |
| |
| In summary, leveraged capital flow/posture, fractal patterns that model trend maturity and length, and seasonality can collectively identify areas where trend is likely to end, providing excellent insight into potential asymmetric price movement ahead. This data can be overlayed on a traditional supply/demand analytical process or used independently. For intermediate and long-term timeframes, caution should be exercised as relates to energy positioning in the near-term until the 3-wave corrective pattern (and MM Net Posture downtrend) begun in late October 2021 terminates. |
Sharedata Futures, Inc. provides historical data mining and visualization for the benchmark NYMEX Energy Futures Markets.
Sharedata combines structural analysis of the market generated data, dynamic systems analysis, and Bayesian causal inference techniques favored by the scientific and intelligence communities to provide a robust framework for addressing the uncertainty and risk in energy pricing.
| Title: | Founder |
| Company: | Sharedata Futures, Inc. |
| Dallas, TX | |
| Website: | www.sdfanalytics.com |
| E-mail address: | support@sdfanalytics.com |
Traders' Resource Links | |
| Sharedata Futures, Inc. has not added any product or service information to TRADERS' RESOURCE. | |
Click here for more information about our publications!
Comments
Date:�02/13/22Rank:�5Comment:�

Request Information From Our Sponsors
- StockCharts.com, Inc.
- Candle Patterns
- Candlestick Charting Explained
- Intermarket Technical Analysis
- John Murphy on Chart Analysis
- John Murphy's Chart Pattern Recognition
- John Murphy's Market Message
- MurphyExplainsMarketAnalysis-Intermarket Analysis
- MurphyExplainsMarketAnalysis-Visual Analysis
- StockCharts.com
- Technical Analysis of the Financial Markets
- The Visual Investor
- VectorVest, Inc.
- Executive Premier Workshop
- One-Day Options Course
- OptionsPro
- Retirement Income Workshop
- Sure-Fire Trading Systems (VectorVest, Inc.)
- Trading as a Business Workshop
- VectorVest 7 EOD
- VectorVest 7 RealTime/IntraDay
- VectorVest AutoTester
- VectorVest Educational Services
- VectorVest OnLine
- VectorVest Options Analyzer
- VectorVest ProGraphics v6.0
- VectorVest ProTrader 7
- VectorVest RealTime Derby Tool
- VectorVest Simulator
- VectorVest Variator
- VectorVest Watchdog