

HOT TOPICS LIST
- MACD
- Fibonacci
- RSI
- Gann
- ADXR
- Stochastics
- Volume
- Triangles
- Futures
- Cycles
- Volatility
- ZIGZAG
- MESA
- Retracement
- Aroon
INDICATORS LIST
LIST OF TOPICS
PRINT THIS ARTICLE
by Taylor Ireland
Analysis of derivatives informs a risk management process. Recent COT data reflects meaningful short posture by leveraged participants continues. Leveraged capital posture and total open interest remain below levels where highs have historically formed. While a completion of the initial rally from 1.800s has occurred, COT data continues to support the premise for higher prices in the intermediate term. In this article, we examine the leveraged capital positioning contributing to the Natural Gas futures (NG) rally.
Position: N/A
Taylor Ireland
Sharedata Futures, Inc. provides historical data mining and visualization for the benchmark NYMEX Energy Futures Markets.
Sharedata combines structural analysis of the market generated data, dynamic systems analysis, and Bayesian causal inference techniques favored by the scientific and intelligence communities to provide a robust framework for addressing the uncertainty and risk in energy pricing.
PRINT THIS ARTICLE
ENERGY
Natural Gas' COT & Price Structure Suggest Further Upside Lays Ahead
12/16/21 03:20:18 PMby Taylor Ireland
Analysis of derivatives informs a risk management process. Recent COT data reflects meaningful short posture by leveraged participants continues. Leveraged capital posture and total open interest remain below levels where highs have historically formed. While a completion of the initial rally from 1.800s has occurred, COT data continues to support the premise for higher prices in the intermediate term. In this article, we examine the leveraged capital positioning contributing to the Natural Gas futures (NG) rally.
Position: N/A
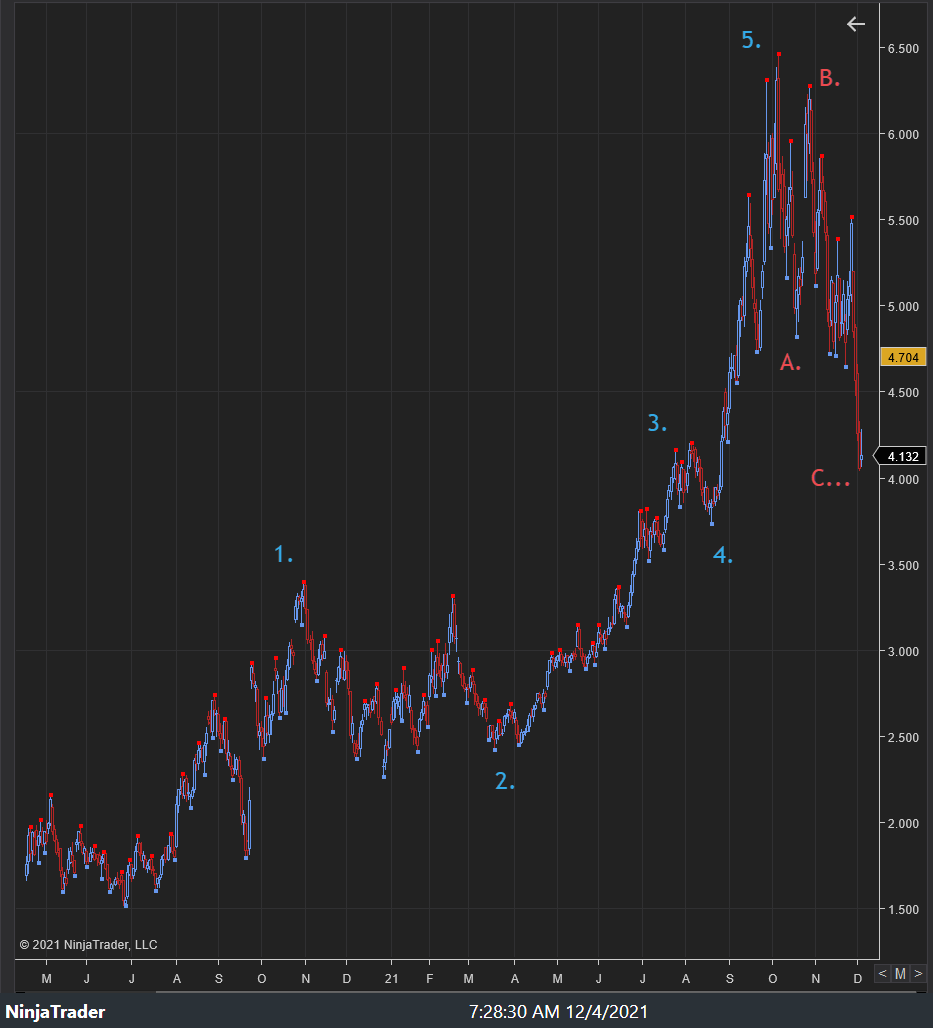
| Natural systems (of which financial markets are a part) grow in cycles of five waves and contract in cycles of three waves. This logic is part of fractal geometry and is applied historically in markets in what can be referred to as Elliott Wave Theory (named for chartist R.N Elliott). Based on this logic, we can plot a trend model from the secular low formed in April 2020 near 1.800s. While open to multiple interpretations, the market currently appears to have completed its initial 5 wave cycle higher in early October 2021 near 6.466s. A 3 wave corrective cycle has since developed toward 4.042s into early December 2021. The primary expectation going forward is that the current corrective phase will resolve with a new, larger 5 wave cycle higher in the coming months ahead. When Commitment of Traders (COT) data is overlayed on this model, we can see more specifically the posture of large, leveraged participants known as Managed Money (MM) who can affect price in substantial ways. |
|
| Figure 1. Henry Hub Natural Gas |
| Graphic provided by: NinjaTrader. |
| |
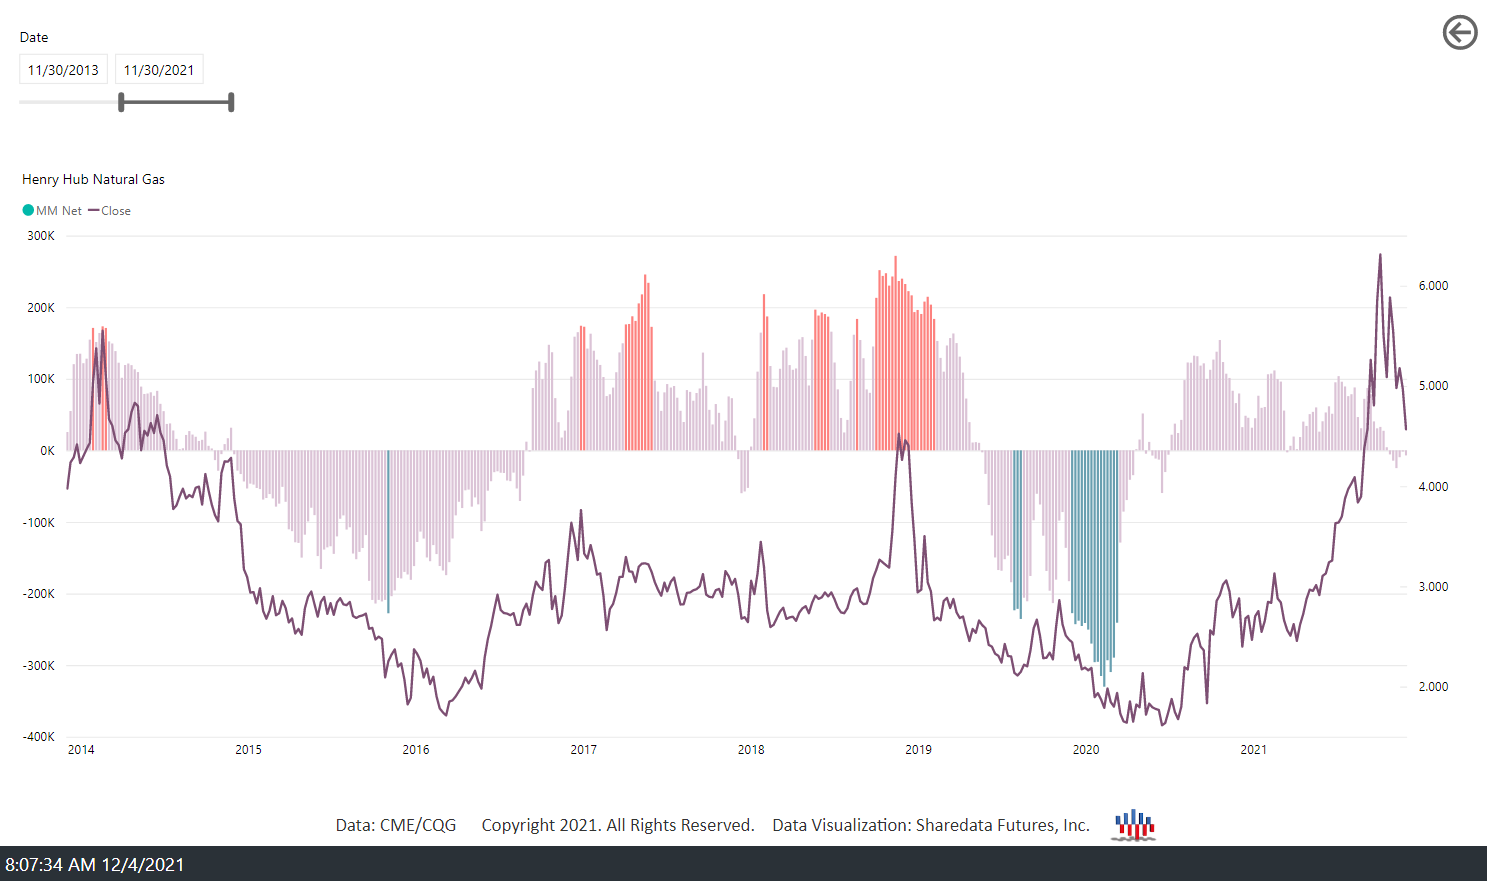
| Despite the pervasive bearish narratives near 1.800s, the MM posture had reached a record net short position of -330k contracts. This data indicated the leveraged participants were short in an extreme manner near major price lows. When compiling and plotting the historical MM COT data, it is evident that when MM's net posture reaches -200k to -300k contracts, meaningful rallies generally follow. Most recently, this type of rally developed in 2016 where NG traded from 1.700s to 4.520s. It wasn't until MM net posture reached +270k contracts in Nov 2018 with no material offsetting short position that the price high developed. |
|
| Figure 2. Henry Hub Natural Gas Managed Money Net Position |
| Graphic provided by: Sharedata Futures, Inc.. |
| |
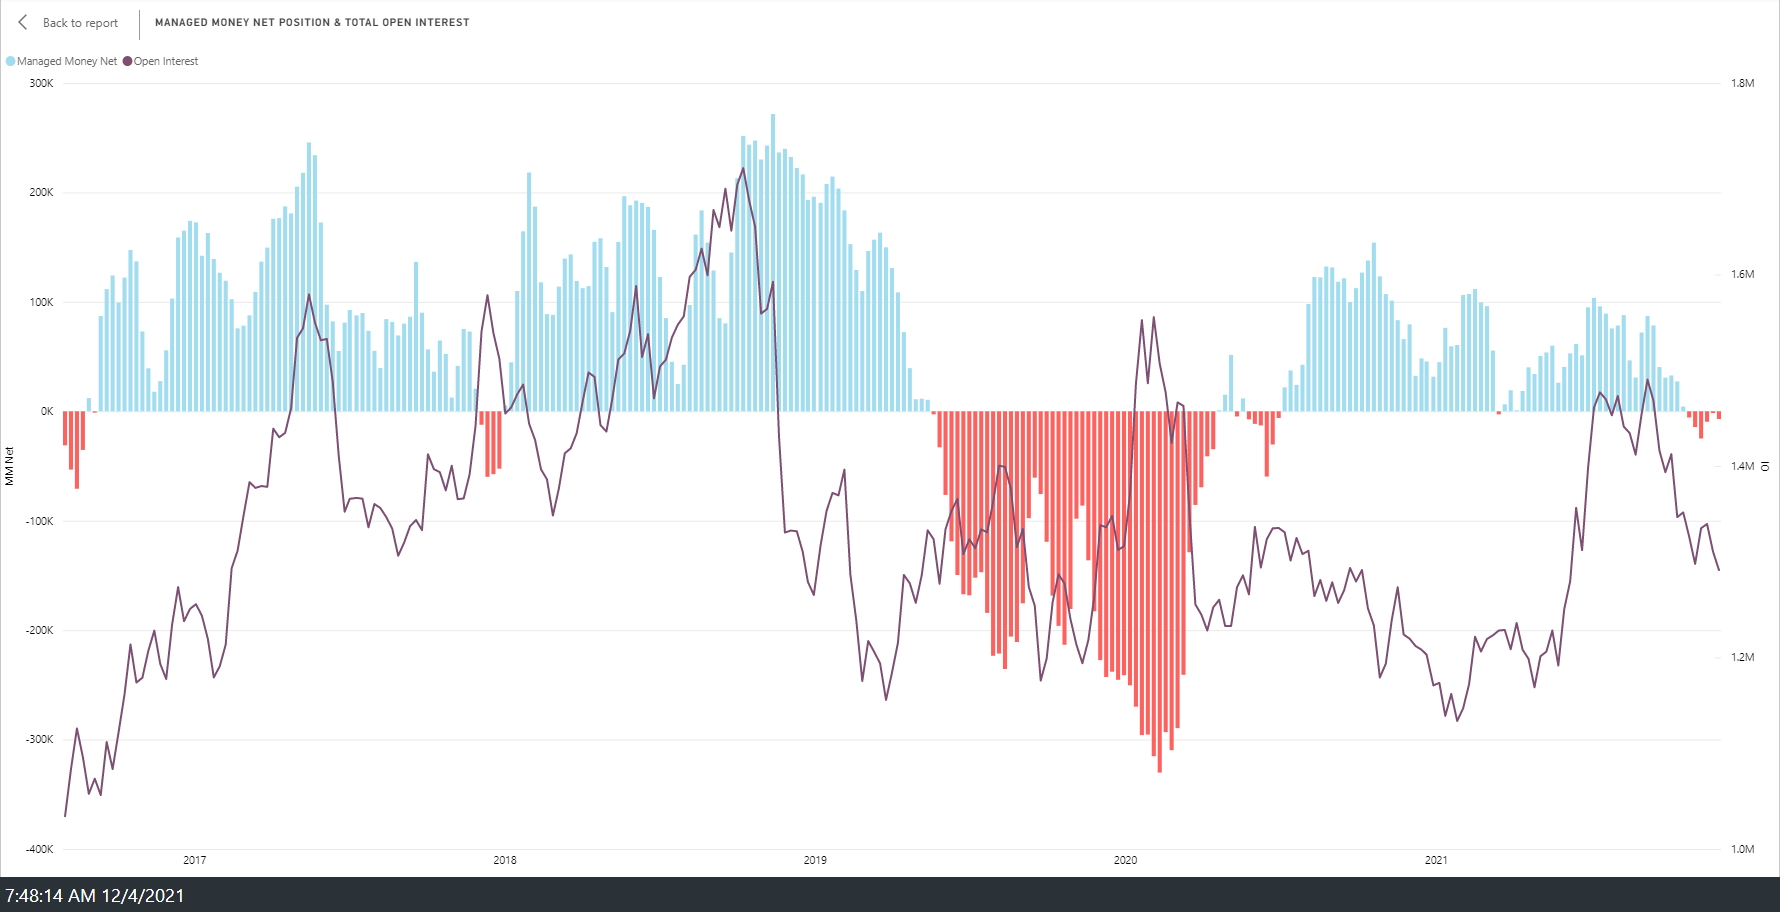
| Despite the substantial rally that has already developed from 1.800s-6.466s, MM net posture and total open interest for NG imply that further price discovery higher is likely. Looking back on a 5-year data set, the market data indicates that price highs require MM net posture of +200-300k contracts and total open interest of 1.5-1.7 million contracts to form. Currently, MM net posture resides at -7k contacts with total open interest near 1.3 million contracts. Additional leverage that is buyside will need to enter the market before a structural high can form. |
|
| Figure 3. Henry Hub Natural Gas Managed Money As % Of Open Interest |
| Graphic provided by: Sharedata Futures, Inc.. |
| |
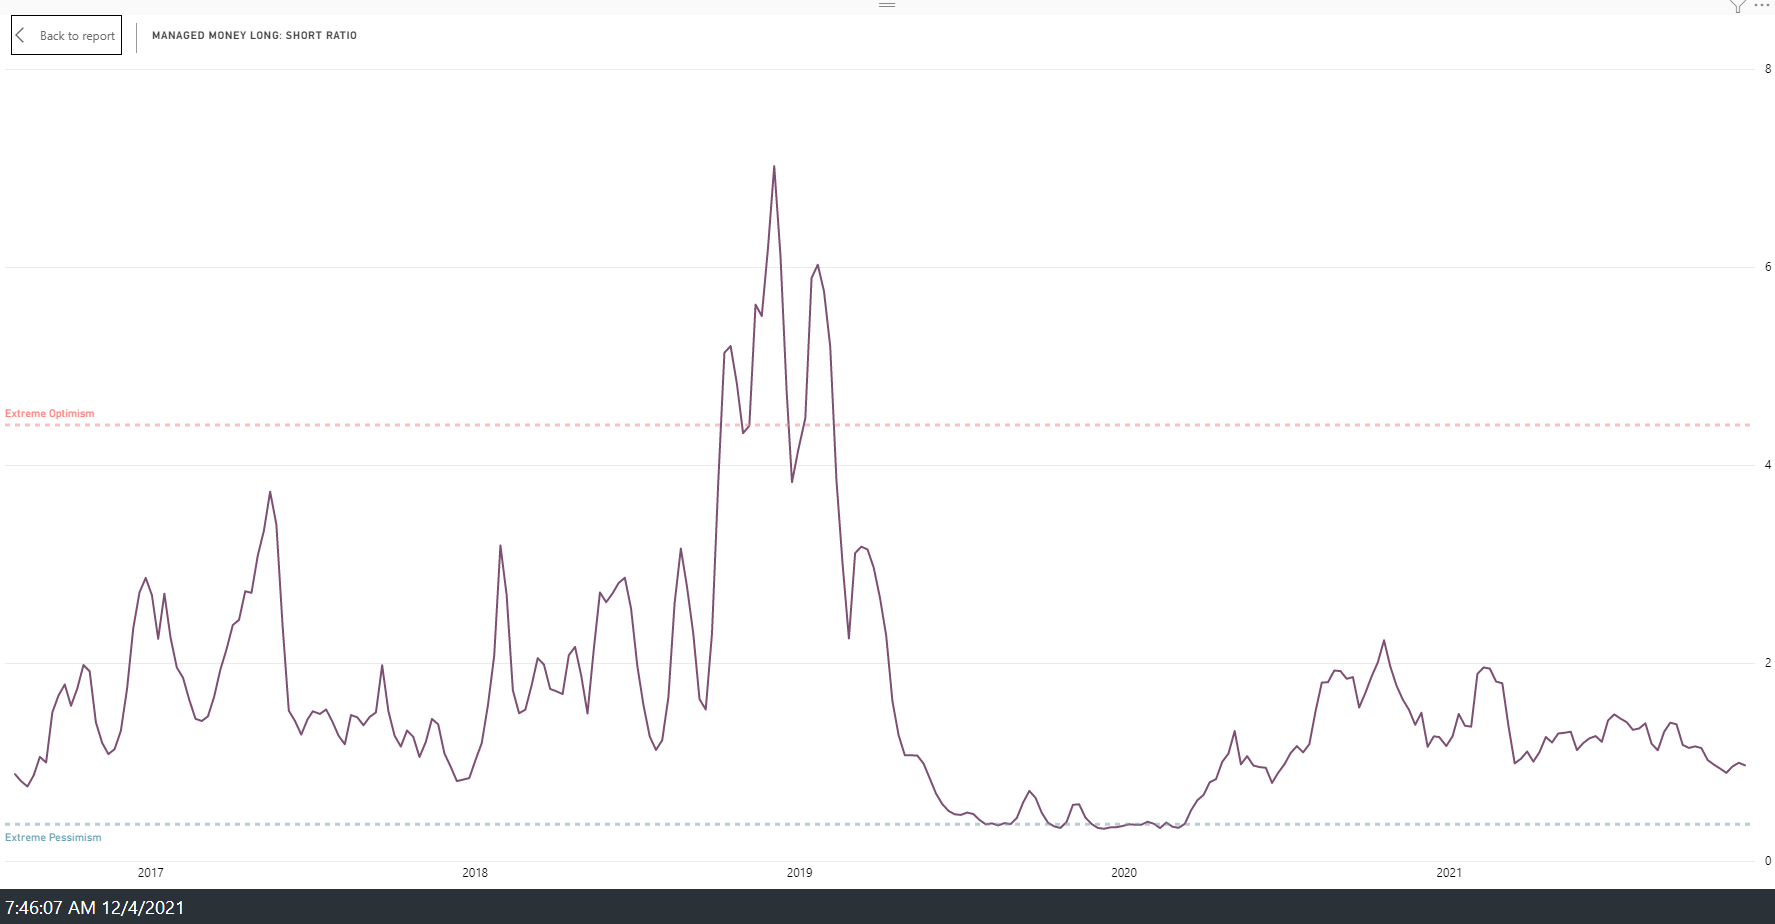
| Beyond the quantitative metrics of MM net posture and total open interest is the qualitative metric of MM Long: Short Ratio. This ratio indicates when MM participants are predominantly buyers and/or holding long positions and vice-versa. Price extremes generally require MM participants to concentrate their positioning extreme bullish or bearish. Current data shows that the MM Long: Short Ratio (.97:1) remains well below a state of extreme optimism (3:1 or higher). It is only when MM participants are "herding" as evidenced by this data that meaningful price extremes form. It is reasonable to infer that the market will need to see a state of "FOMO" (Fear Of Missing Out) by the MM participants to create this condition of extreme position herding. |
|
| Figure 4. Henry Hub Natural Gas Managed Money Long: Short Ratio |
| Graphic provided by: Sharedata Futures, Inc.. |
| |
| In summary, leveraged capital posture, ratio, and total open interest provide key insight into where trends may end. Price extremes form, in part, due to extreme leverage and sentiment created by the leveraged capital participants. This data can be overlayed on a traditional supply/demand analytical process or used independently. For intermediate and long-term timeframes, near-term weakness in natural gas could be viewed as favorable long entry opportunities until this cycle of MM buying completes. |
Sharedata Futures, Inc. provides historical data mining and visualization for the benchmark NYMEX Energy Futures Markets.
Sharedata combines structural analysis of the market generated data, dynamic systems analysis, and Bayesian causal inference techniques favored by the scientific and intelligence communities to provide a robust framework for addressing the uncertainty and risk in energy pricing.
| Title: | Founder |
| Company: | Sharedata Futures, Inc. |
| Dallas, TX | |
| Website: | www.sdfanalytics.com |
| E-mail address: | support@sdfanalytics.com |
Traders' Resource Links | |
| Sharedata Futures, Inc. has not added any product or service information to TRADERS' RESOURCE. | |
Click here for more information about our publications!
PRINT THIS ARTICLE

Request Information From Our Sponsors
- VectorVest, Inc.
- Executive Premier Workshop
- One-Day Options Course
- OptionsPro
- Retirement Income Workshop
- Sure-Fire Trading Systems (VectorVest, Inc.)
- Trading as a Business Workshop
- VectorVest 7 EOD
- VectorVest 7 RealTime/IntraDay
- VectorVest AutoTester
- VectorVest Educational Services
- VectorVest OnLine
- VectorVest Options Analyzer
- VectorVest ProGraphics v6.0
- VectorVest ProTrader 7
- VectorVest RealTime Derby Tool
- VectorVest Simulator
- VectorVest Variator
- VectorVest Watchdog
- StockCharts.com, Inc.
- Candle Patterns
- Candlestick Charting Explained
- Intermarket Technical Analysis
- John Murphy on Chart Analysis
- John Murphy's Chart Pattern Recognition
- John Murphy's Market Message
- MurphyExplainsMarketAnalysis-Intermarket Analysis
- MurphyExplainsMarketAnalysis-Visual Analysis
- StockCharts.com
- Technical Analysis of the Financial Markets
- The Visual Investor