

HOT TOPICS LIST
- MACD
- Fibonacci
- RSI
- Gann
- ADXR
- Stochastics
- Volume
- Triangles
- Futures
- Cycles
- Volatility
- ZIGZAG
- MESA
- Retracement
- Aroon
INDICATORS LIST
LIST OF TOPICS
PRINT THIS ARTICLE
by Mark Rivest
See how the S&P 500 200-day Moving Average generates signals.
Position: Sell
Mark Rivest
Independent investment advisor, trader and writer. He has written articles for Technical Analysis of Stocks & Commodities, Traders.com Advantage,Futuresmag.com and, Finance Magnates. Author of website Four Dimension Trading.
PRINT THIS ARTICLE
MOVING AVERAGES
Signals From the 200-Day Moving Average
10/01/21 03:15:50 PMby Mark Rivest
See how the S&P 500 200-day Moving Average generates signals.
Position: Sell
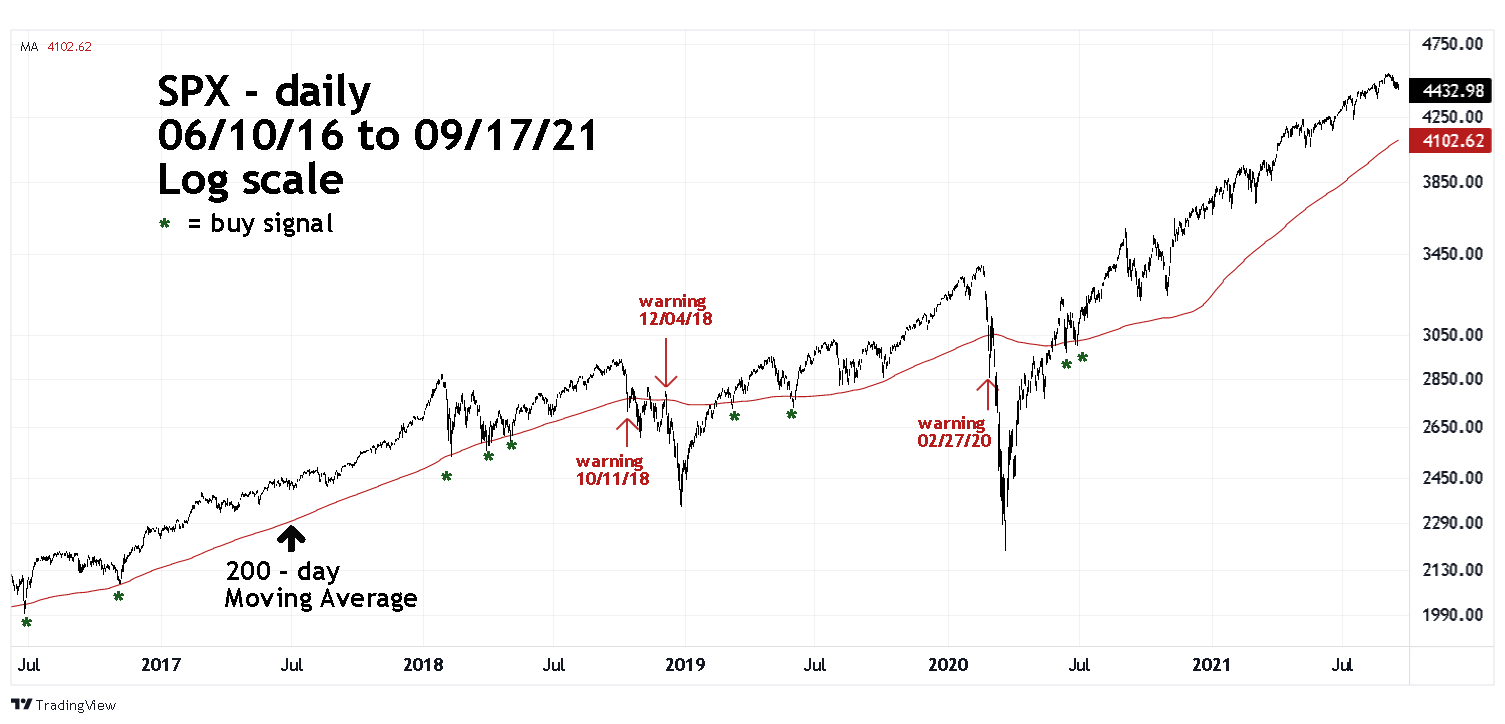
| The 200-day Moving Average (MA) has been widely used for many years. The performance for most US stock market traders/analysts is gauged to the performance of the S&P 500 (SPX). Because of these two factors it's possible the 200-day MA when used on the SPX has become a self-fulfilling prophecy. Action of the SPX during the last five years illustrates parameters in which to make buy/sell decisions. S&P 500 - 2016 to 2021 Please see the daily SPX chart illustrated in Figure 1. The 200-day MA data on this chart is based on tradingview.com calculations; other systems may yield different results. There are various types of moving averages such as "Weighted" and "Exponential". The moving average in this chart is listed in the tradingview.com indicators section as "Moving Average". The signals generated from the SPX 200-day MA from 2016 to 2020 are based upon the primary SPX trend being up and how large of a percentage move is made on the initial break below the 200-day MA. When the initial break below the 200-day MA is less than 2% it's a buy signal. If the initial break below the 200-day MA is equal or greater than 2% it's a warning sign that something more bearish could be developing. The initial greater than 2% break is not necessarily a sell signal because there's a chance for near-term upside action. There have been 16 initial breaks below the SPX 200-day MA since June of 2016. For the sake of clarity only 12 are illustrated. The green asterisk denotes initial break buy signals. The following are dates and initial break percentage moves: Date Percentage loss 06/27/16 -1.47% 11/04/16 0% held at line 02/09/18 -.20% 04/21/18 -1.40% 05/03/18 -.75% 03/07/19 -.45% 05/29/19 -.40% 06/11/20 -.45% 06/26/20 -.50% With the primary SPX trend up, all of the initial breaks below the 200-day MA of less than 2% were effective buy signals. |
|
| Figure 1. With the primary SPX trend up, all of the initial breaks below the 200-day MA of less than 2% were effective buy signals. |
| Graphic provided by: TradingView. |
| |
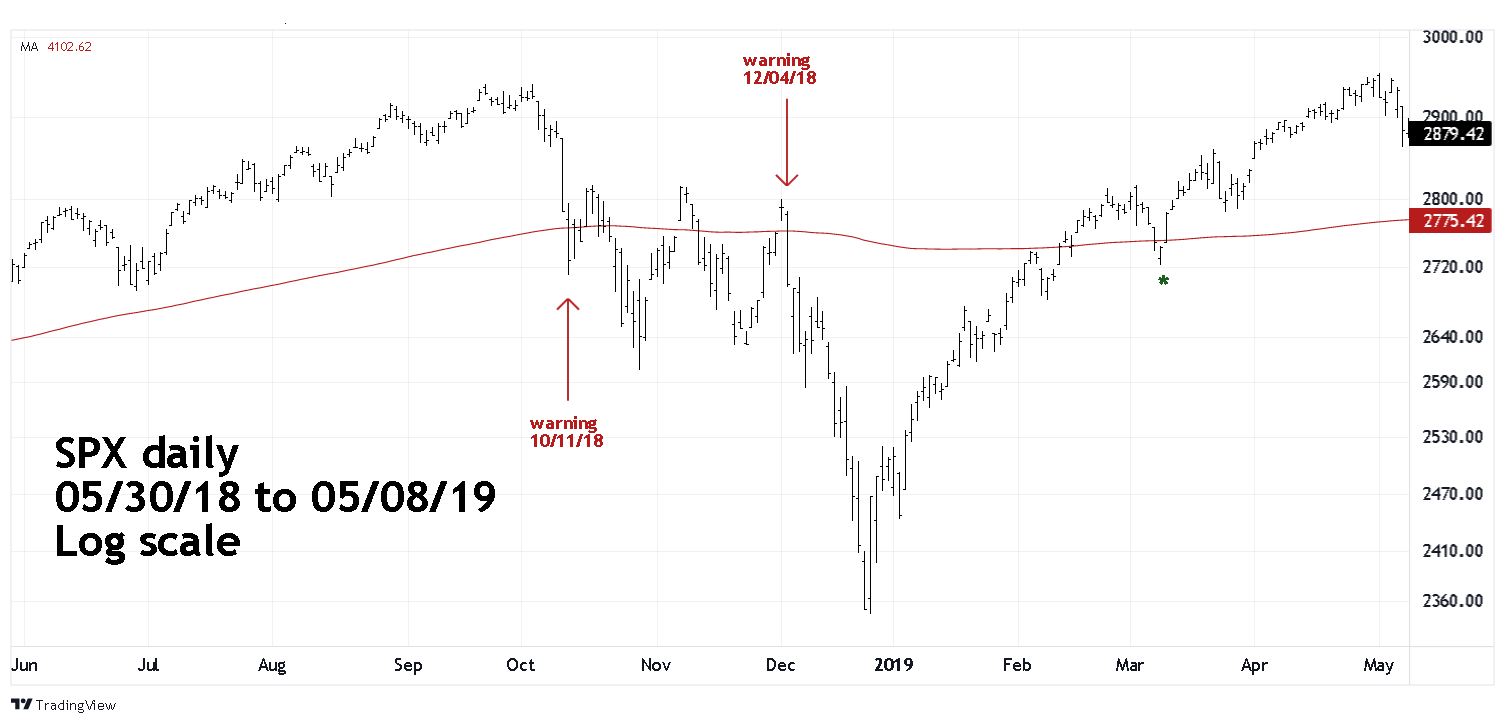
| Warning Signals - 2018 In 2018 there were two warning signals — the first came on 10/11/18. Please see the daily SPX chart 2018 to 2019 illustrated in Figure 2. A sharp six trading day decline caused an initial break of a 2% move below the 200-day MA triggering a warning that something more bearish could be developing. Because of the prior sharp decline, it's not surprising the bulls were able to mount a short-term rally. In situations where the initial break comes after a sharp drop, a move back up to the 200-day MA line could allow for a better position to sell or start selling. Subsequently there was a brief move above the 200-day MA, then another break below the line. While this initial break was not greater than 2% the subsequent decline developed into a greater than 2% decline. Moves of several trading days below the 200-day MA are also a warning signal to at least start selling. On 10/29/18 the SPX bottomed about 6% below the 200-day MA. November is seasonally the most bullish month for US stocks so it's not surprising the bulls mounted two more rallies above the 200-day MA. What happened 12/04/18 was a strong warning. The SPX plunged more than 2% below the line. Taken in the context of the prior warnings and failed moves above the line it was a signal for aggressive selling. |
|
| Figure 2. A sharp six trading day decline caused an initial break of a 2% move below the 200-day MA. |
| Graphic provided by: TradingView. |
| |
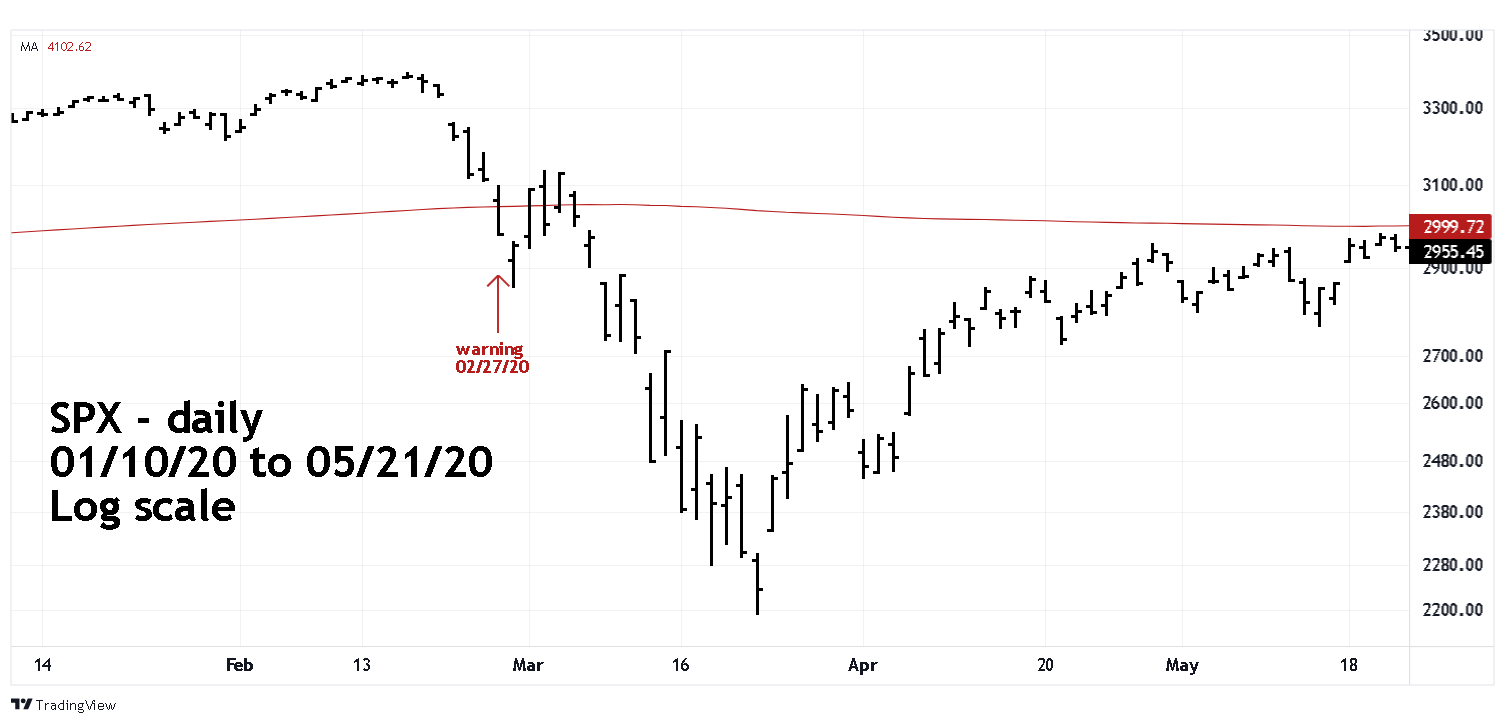
| Warning Signal - 2020 Please see the daily SPX chart January to May 2020 illustrated in Figure 3. Similar to what happened in October 2018 there was a sharp decline that preceded the initial break of greater than 2% below the 200-day MA. However, the next trading day there was more downside progress — a warning on top of a warning. The subsequent move briefly back above the line was a gift for anyone thinking about selling. |
|
| Figure 3. The subsequent move briefly back above the line was a gift for anyone thinking about selling. |
| Graphic provided by: TradingView. |
| |
| Future Potential Signal No system is perfect, trading is about probabilities not certainties. The SPX record of breaks at the 200-day MA is impressive and implies the next signal has a good chance of being effective. The SPX made its all-time high on 09/02/21. As of 09/17/21 there's been only a meager 2.5% decline with the 200-day MA near 4100, about a 9.7% drop from the all-time high. For US stocks September to October is seasonally a bearish time zone. Considering how relentless the upside action has been since March 2020 a move down to just the 200-day MA might be considered a low probability. If the SPX can make its way down to the 200-day MA before the end of October, there could be an important buy or warning signal. |
Independent investment advisor, trader and writer. He has written articles for Technical Analysis of Stocks & Commodities, Traders.com Advantage,Futuresmag.com and, Finance Magnates. Author of website Four Dimension Trading.
| Website: | www.fourdimensiontrading.com |
| E-mail address: | markrivest@gmail.com |
Click here for more information about our publications!
PRINT THIS ARTICLE

Request Information From Our Sponsors
- StockCharts.com, Inc.
- Candle Patterns
- Candlestick Charting Explained
- Intermarket Technical Analysis
- John Murphy on Chart Analysis
- John Murphy's Chart Pattern Recognition
- John Murphy's Market Message
- MurphyExplainsMarketAnalysis-Intermarket Analysis
- MurphyExplainsMarketAnalysis-Visual Analysis
- StockCharts.com
- Technical Analysis of the Financial Markets
- The Visual Investor
- VectorVest, Inc.
- Executive Premier Workshop
- One-Day Options Course
- OptionsPro
- Retirement Income Workshop
- Sure-Fire Trading Systems (VectorVest, Inc.)
- Trading as a Business Workshop
- VectorVest 7 EOD
- VectorVest 7 RealTime/IntraDay
- VectorVest AutoTester
- VectorVest Educational Services
- VectorVest OnLine
- VectorVest Options Analyzer
- VectorVest ProGraphics v6.0
- VectorVest ProTrader 7
- VectorVest RealTime Derby Tool
- VectorVest Simulator
- VectorVest Variator
- VectorVest Watchdog