

HOT TOPICS LIST
- MACD
- Fibonacci
- RSI
- Gann
- ADXR
- Stochastics
- Volume
- Triangles
- Futures
- Cycles
- Volatility
- ZIGZAG
- MESA
- Retracement
- Aroon
INDICATORS LIST
LIST OF TOPICS
PRINT THIS ARTICLE
by Taylor Ireland
In this article, we examine significant futures and options positioning along with historical seasonality driving WTI price action.
Position: N/A
Taylor Ireland
Sharedata Futures, Inc. provides historical data mining and visualization for the benchmark NYMEX Energy Futures Markets.
Sharedata combines structural analysis of the market generated data, dynamic systems analysis, and Bayesian causal inference techniques favored by the scientific and intelligence communities to provide a robust framework for addressing the uncertainty and risk in energy pricing.
PRINT THIS ARTICLE
DERIVATIVES
Options & COT: WTI's Recent Correction Could Be Better Understood Through Its Derivatives
08/12/21 04:47:13 PMby Taylor Ireland
In this article, we examine significant futures and options positioning along with historical seasonality driving WTI price action.
Position: N/A
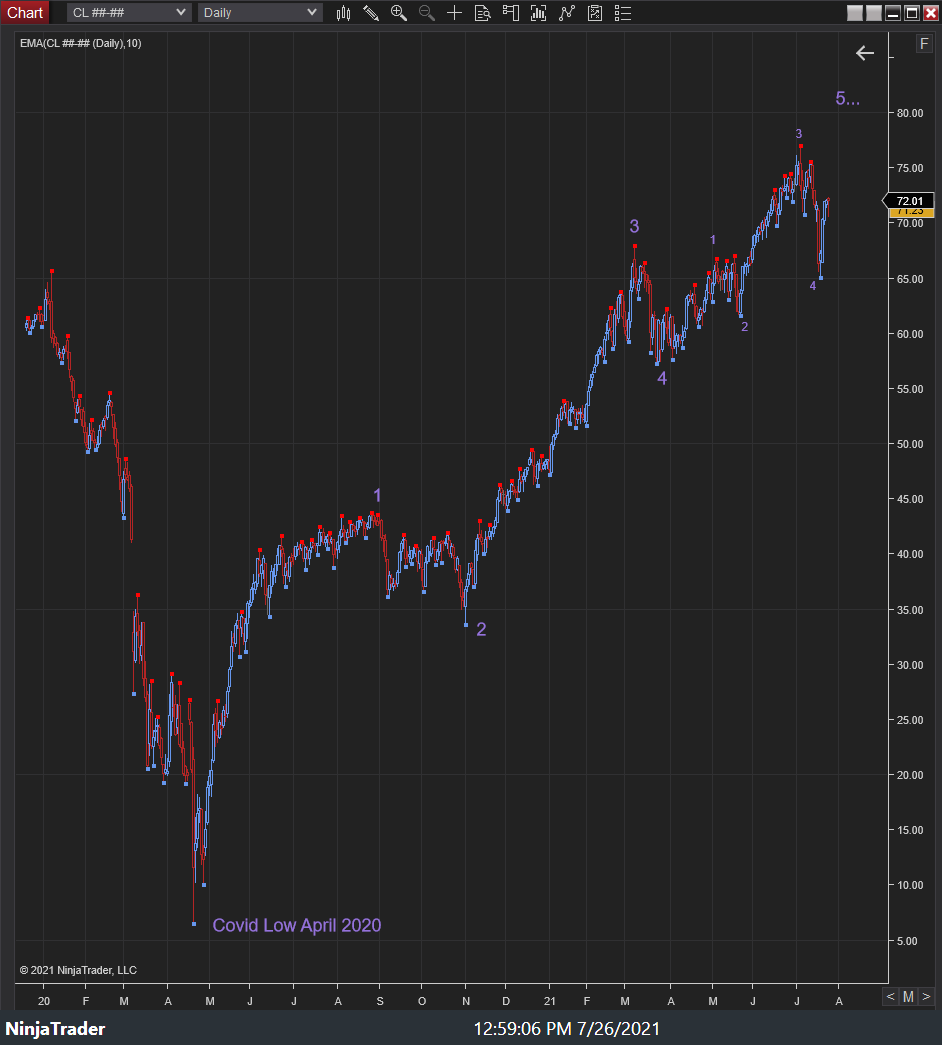
| Natural systems (of which financial markets are a part) grow in cycles of five waves and contract in cycles of three waves. This logic is part of fractal geometry and is applied historically in markets in what can be referred to as Elliott Wave Theory (named for chartist R.N Elliott). Based on this logic, we can plot a trend model from the secular low formed in April 2020. While open to multiple interpretations, this is our current primary expectation of WTI's current trend. The market currently appears to be in its 5th expansionary wave higher begun following the March 2021 correction to 55.20s. When Commitment of Traders (COT) data is overlayed on this model, we can see more specifically the posture of large, leveraged participants known as Managed Money (MM) who can affect price in substantial ways. |
|
| Figure 1. WTI Price & Wave Count. |
| Graphic provided by: NinjaTrader. |
| |
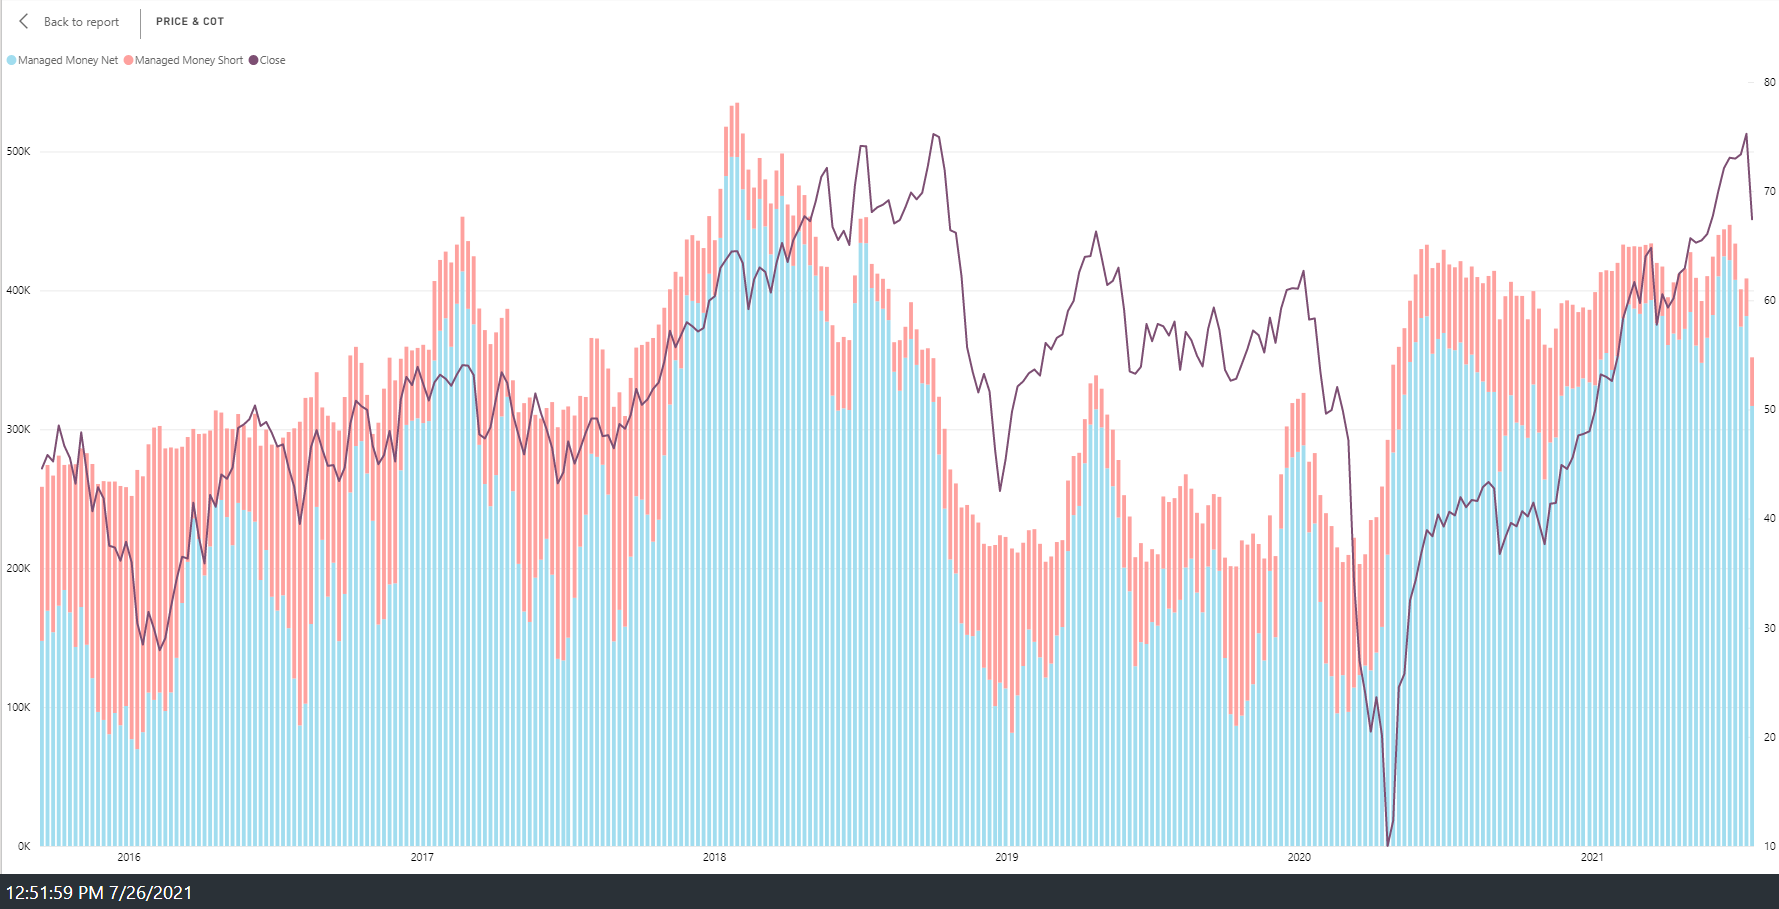
| When compiling and plotting the historical MM COT data, it is evident that when MM's net posture reaches +300k-400k contracts, meaningful corrections generally follow. These types of corrections occurred in 2017, 2018, and 2019-2020. Following the April 2020 "Covid" low, the market rallied into June 2021 toward the mid-$70s, where once again, the Managed Money net posture reached +424k contracts (424 million barrels in net length). This posture occurred with no material offsetting short position. |
|
| Figure 2. WTI Commitment Of Traders (Managed Money Net Posture). |
| Graphic provided by: Sharedata Futures, Inc.. |
| |
| From the positioning of leveraged capital and a completed 3rd wave expansion higher from $57.22s, it was reasonable to infer that a 4th corrective wave could develop. A structural high was made near $76 early in July before an initial selloff developed to $70.50s. The relief rally that followed halted at $75s. Given these amplitudes, a price target zone for the completion of a corrective phase was 66.43s-64.96s (the 138-161% Fibonacci extensions of the initial selloff). The market continued the corrective phase into mid-July to 65.06s where large buying interest could be seen in the order flow amidst a buy excess or single print. These were structural indications of a low. |
|
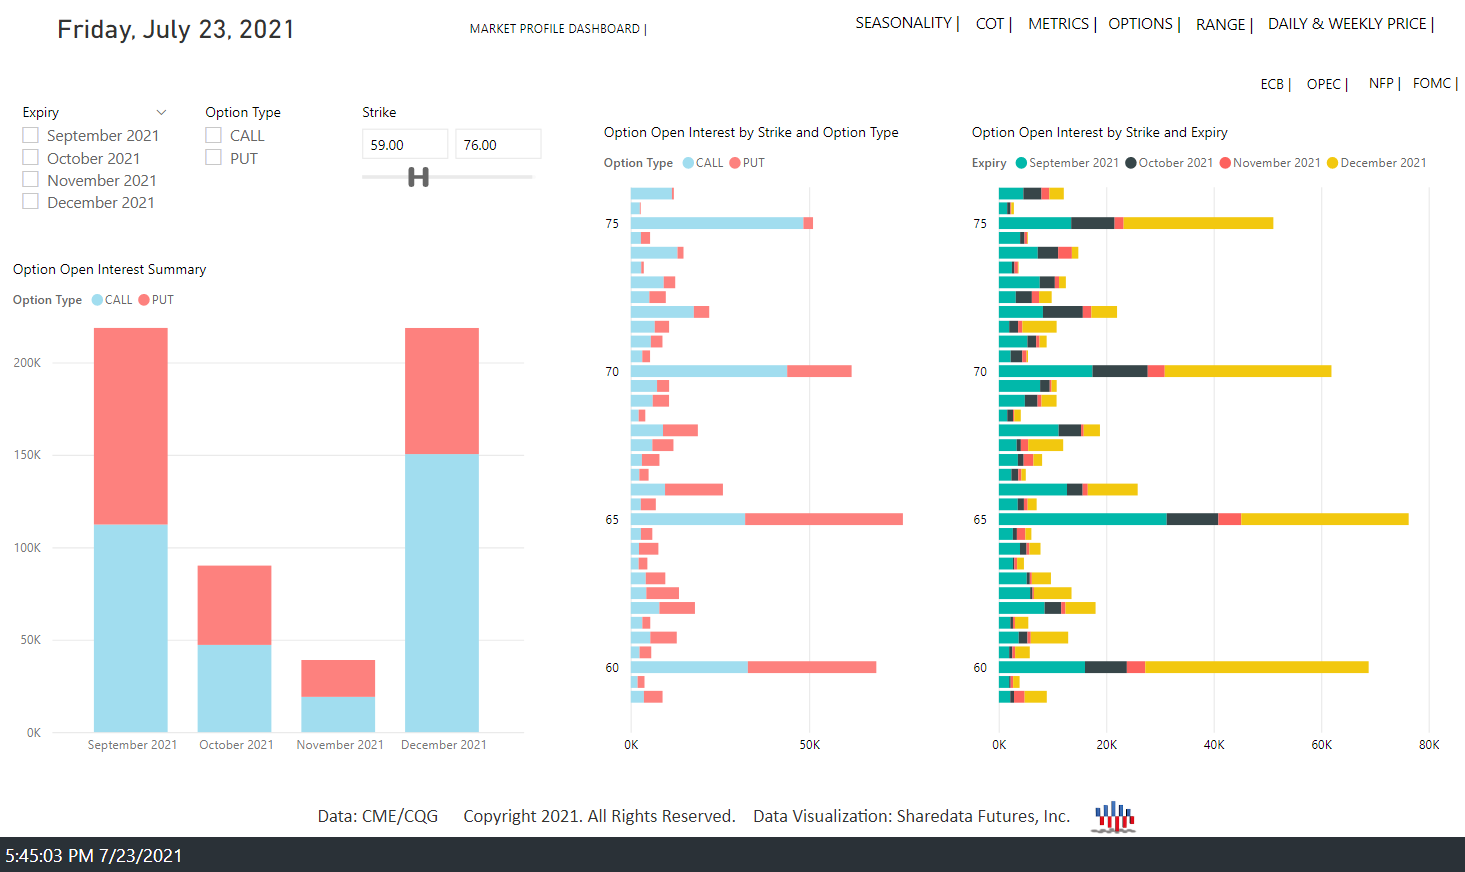
| Figure 3. WTI Options Dashboard. |
| Graphic provided by: Sharedata Futures, Inc.. |
| |
| Beyond the fractal pattern and MM posture, there was another market data point to provide key insight: the WTI options. The graph below plots a 4-month curve of WTI futures options. Strike prices of high open interest (OI) often serve as levels of support/resistance and areas where price will tend to gravitate toward. When levels with high OI are breached, it can often exacerbate the underlying trend as the dealers of those options must hedge delta/gamma exposure by buying futures (in the case of breakouts) or selling futures (in the case of breakdowns). In this month's case, it is likely the break of the $70 strike caused additional selling of futures by dealers, exacerbating the selloff. The market traded almost precisely to the $65 strike, the level of highest OI and highest put OI. Large buying interest emerged there, halting the selloff. That level held and subsequently, the market promptly rallied back to the $70-72.50s, where consolidation ensued. The stretched MM net posture, the formation of a high and subsequent corrective phase likely to terminate in the 66.43s-64.96s area, and the large option OI at the $65 provided context and insight based on capital flow and market positioning as to the likely correction target. |
|
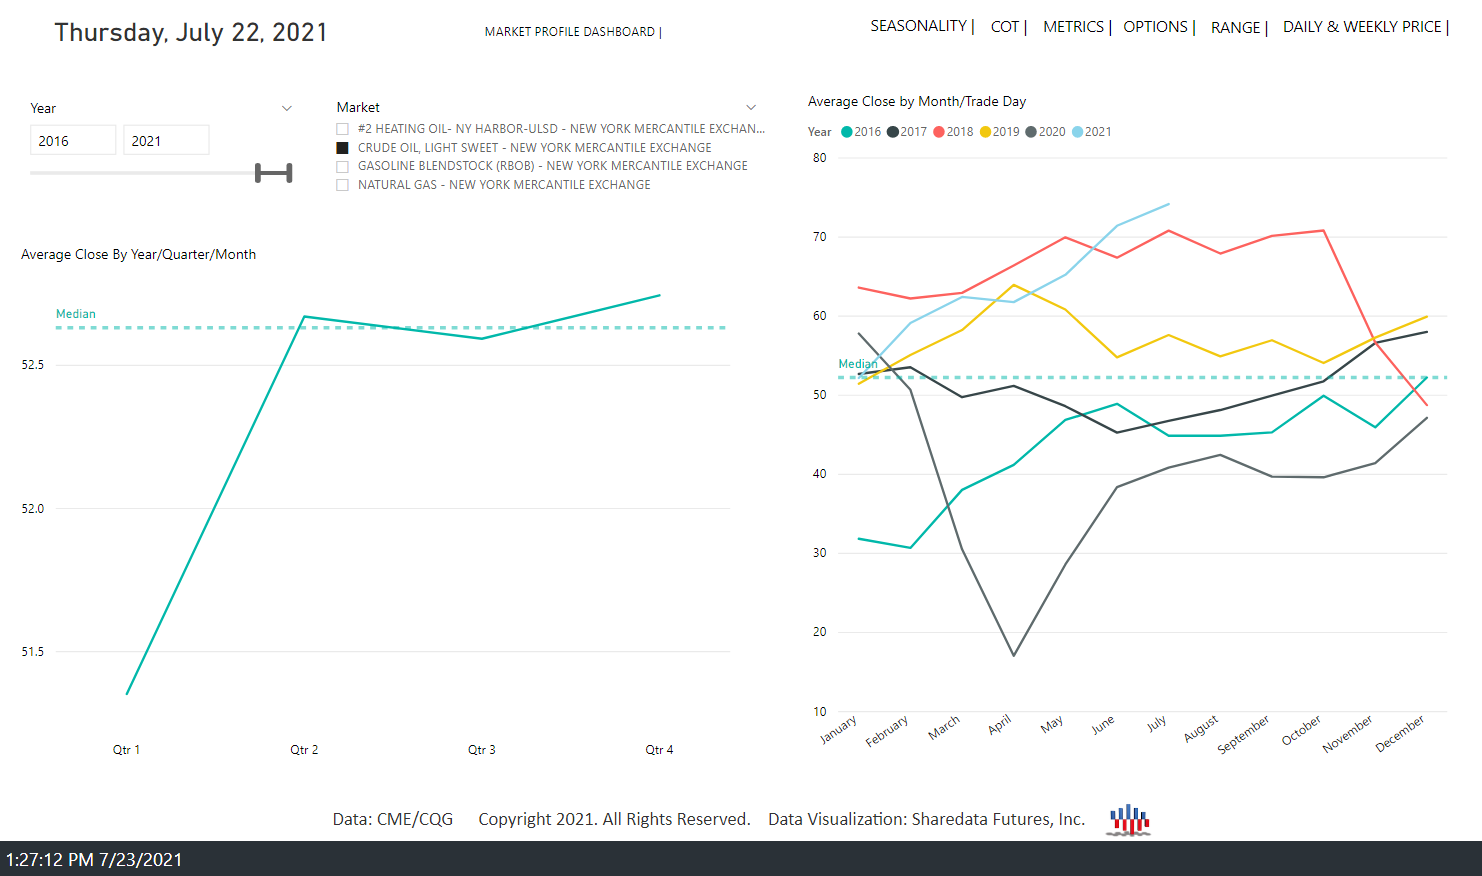
| Figure 4. WTI Seasonality. |
| Graphic provided by: Sharedata Futures, Inc.. |
| |
| Finally, we come to seasonality. The graph below plots the seasonality of the WTI contract back to 1980. Here we see a 5-year view. WTI seasonality is neutral to bearish, on a historical basis, July-September, on 5/10/15/20Yr timeframes. Given the amplitude of the recent rally and MM net posture, this effect may serve as an additional headwind to materially higher prices in WTI. In summary, leveraged capital flow/posture, fractal patterns that model trend maturity and length, and large option OI that identify key potential support/resistance can collectively provide excellent insight into potential asymmetric price movement ahead and its potential price targets. This data can be overlayed on a traditional supply/demand analytical process or used independently. For intermediate and long-term timeframes, caution should be exercised as relates to energy positioning in the near-term. |
Sharedata Futures, Inc. provides historical data mining and visualization for the benchmark NYMEX Energy Futures Markets.
Sharedata combines structural analysis of the market generated data, dynamic systems analysis, and Bayesian causal inference techniques favored by the scientific and intelligence communities to provide a robust framework for addressing the uncertainty and risk in energy pricing.
| Title: | Founder |
| Company: | Sharedata Futures, Inc. |
| Dallas, TX | |
| Website: | www.sdfanalytics.com |
| E-mail address: | support@sdfanalytics.com |
Traders' Resource Links | |
| Sharedata Futures, Inc. has not added any product or service information to TRADERS' RESOURCE. | |
Click here for more information about our publications!
PRINT THIS ARTICLE

Request Information From Our Sponsors
- VectorVest, Inc.
- Executive Premier Workshop
- One-Day Options Course
- OptionsPro
- Retirement Income Workshop
- Sure-Fire Trading Systems (VectorVest, Inc.)
- Trading as a Business Workshop
- VectorVest 7 EOD
- VectorVest 7 RealTime/IntraDay
- VectorVest AutoTester
- VectorVest Educational Services
- VectorVest OnLine
- VectorVest Options Analyzer
- VectorVest ProGraphics v6.0
- VectorVest ProTrader 7
- VectorVest RealTime Derby Tool
- VectorVest Simulator
- VectorVest Variator
- VectorVest Watchdog
- StockCharts.com, Inc.
- Candle Patterns
- Candlestick Charting Explained
- Intermarket Technical Analysis
- John Murphy on Chart Analysis
- John Murphy's Chart Pattern Recognition
- John Murphy's Market Message
- MurphyExplainsMarketAnalysis-Intermarket Analysis
- MurphyExplainsMarketAnalysis-Visual Analysis
- StockCharts.com
- Technical Analysis of the Financial Markets
- The Visual Investor