HOT TOPICS LIST
- MACD
- Fibonacci
- RSI
- Gann
- ADXR
- Stochastics
- Volume
- Triangles
- Futures
- Cycles
- Volatility
- ZIGZAG
- MESA
- Retracement
- Aroon
INDICATORS LIST
LIST OF TOPICS
PRINT THIS ARTICLE
by Gary Grosschadl
Big Blue has been here before ($90), three times in the last 10 months, only to be turned back each time.
Position: N/A
Gary Grosschadl
Independent Canadian equities trader and technical analyst based in Peterborough
Ontario, Canada.
PRINT THIS ARTICLE
CHART ANALYSIS
Will IBM Fail at Gap Resistance?
01/14/03 01:37:49 PMby Gary Grosschadl
Big Blue has been here before ($90), three times in the last 10 months, only to be turned back each time.
Position: N/A
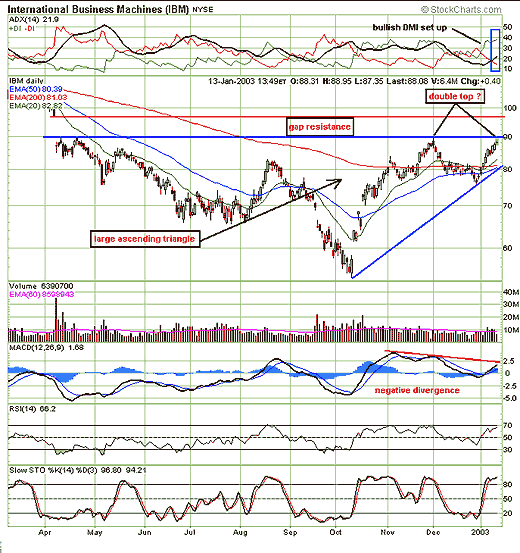
| After a dramatic fall to a four year low, IBM has made a dramatic short term recovery in the past three months, going from $55 back to near $90. This leads me to believe that it is running out of gas again. The bigger question is whether a serious pattern break will occur. |
| This 10-month chart shows a large ascending triangle which is bullish in nature. The longer term trader should wait for a decisive break from this triangle, either upside past $90 or a serious breakdown below $80 which would draw potential shorts in. More aggressive shorter term traders may be anticipating a double top failure here and could play a possible move back down to test support at the $80 level where 50-period EMA and trendline support lie. |

|
| Graphic provided by: StockCharts.com. |
| |
| I have several reasons why I think a downturn back to support is likely here: 1. It's made a good run in the past 10 trading days, going from $76 to $89 and could be due for a stochastic downleg. 2. Formidable gap resistance may induce the start of a double top failure. 3. MACD (moving average convergence/divergence) is showing negative divergence to price action. |
| However a surprise move to the upside should not be completely ruled out. The directional movement indicator at the top of the chart shows a bullish setup still exists and the MACD and stochastics have not turned negative yet. These indicators need a deterioration of price action to start turning sour. |
| In the very near term it is a wait and see scenario, just like the overall indices. Very likely IBM is waiting to take its cue from the Dow itself so, as this pattern starts to resolve, this may mirror similar action elsewhere. But to reiterate - the longer term trader should wait for a decisive break from this triangle, either upside past $90 or a serious breakdown below $80. More aggressive traders may try for the move down to test support (with a protective stop) if conditions worsen in the next few trading days. |
Independent Canadian equities trader and technical analyst based in Peterborough
Ontario, Canada.
| Website: | www.whatsonsale.ca/financial.html |
| E-mail address: | gwg7@sympatico.ca |
Click here for more information about our publications!
Comments
Date: 01/14/03Rank: 5Comment:

Request Information From Our Sponsors
- StockCharts.com, Inc.
- Candle Patterns
- Candlestick Charting Explained
- Intermarket Technical Analysis
- John Murphy on Chart Analysis
- John Murphy's Chart Pattern Recognition
- John Murphy's Market Message
- MurphyExplainsMarketAnalysis-Intermarket Analysis
- MurphyExplainsMarketAnalysis-Visual Analysis
- StockCharts.com
- Technical Analysis of the Financial Markets
- The Visual Investor
- VectorVest, Inc.
- Executive Premier Workshop
- One-Day Options Course
- OptionsPro
- Retirement Income Workshop
- Sure-Fire Trading Systems (VectorVest, Inc.)
- Trading as a Business Workshop
- VectorVest 7 EOD
- VectorVest 7 RealTime/IntraDay
- VectorVest AutoTester
- VectorVest Educational Services
- VectorVest OnLine
- VectorVest Options Analyzer
- VectorVest ProGraphics v6.0
- VectorVest ProTrader 7
- VectorVest RealTime Derby Tool
- VectorVest Simulator
- VectorVest Variator
- VectorVest Watchdog
