HOT TOPICS LIST
- MACD
- Fibonacci
- RSI
- Gann
- ADXR
- Stochastics
- Volume
- Triangles
- Futures
- Cycles
- Volatility
- ZIGZAG
- MESA
- Retracement
- Aroon
INDICATORS LIST
LIST OF TOPICS
PRINT THIS ARTICLE
by Dennis D. Peterson
Understanding the strengths and weaknesses of stochastics can make this a useful indicator.
Position: N/A
Dennis D. Peterson
Market index trading on a daily basis.
PRINT THIS ARTICLE
STOCHASTICS
Stochastics
01/16/03 08:23:16 AMby Dennis D. Peterson
Understanding the strengths and weaknesses of stochastics can make this a useful indicator.
Position: N/A
| Some pundits are seeing a sideways 2003 market characterized by strong price volatility. Choppiness is difficult to trade. Success in trading choppy equities has most often been found with equities in a trading range, by buying support and selling resistance. Of course the risk is if the equity trends. Stochastics are designed for choppy markets. They attempt to recognize overbought/oversold conditions by comparing today's price to the lowest low over a period of time, in comparison to the range of prices as defined by the difference between the highest high and lowest low in the same period of time. (For more information on stochastics, see my article "Calculating Stochastics," Traders.com Advantage, 06/05/01.) |
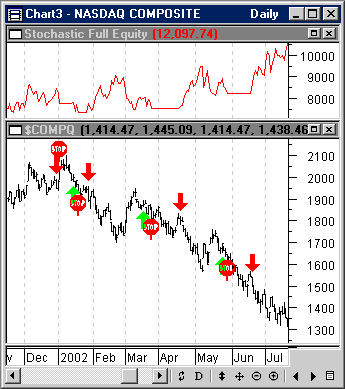
| Stochastics give you an entry point when a market turns. The problem is, if after the move up or down, the move becomes a trend, it either looks like you are overbought or oversold and you switch. But because your are in a trend, you shouldn't have switched and start accumulating a loss. Or very commonly you are in a trend and normal continuation patterns, such as wedges, cause very short-term price reversals that result in losses from being whipsawed. I have built a few of these systems and Figure 1 typifies a series of trades. Namely, if you use stop-losses you see them frequently with long entries in downtrends, and with shorts on uptrends, because of normal continuation patterns in a trend - despite your best efforts to refine entry. For entry, this version of the trading system looks for an oversold or overbought threshold to have been exceeded in the last few trading days, for price change to be currently in a short-term trend in the desired direction (up if oversold and down if overbought), and asks if the stochastics solid line is above or below the dashed line to make sure the momentum is right. |

|
| Figure 1: Nasdaq composite daily price and equity performance. The problem with stochastics is in plain view. Green up arrow are long entries, red down arrows short entries, and the red stop sign an exit for stop-loss. Despite a trading system that is looking for three different conditions for entry, normal continuation patterns in the form of wedges, or just plain rallies or reactions, cause stochastics to falsely think you have switched from being overbought to oversold, or vice versa. To minimize the losses the use of a stop-loss will end up being continual hit on long entries while in a downtrend, and will get hit with shorts on an uptrend. The top chart is equity performance and it is clear it is a bumpy road. |
| Graphic provided by: MetaStock. |
| Graphic provided by: Data Source: eSignal via DBC. |
| |
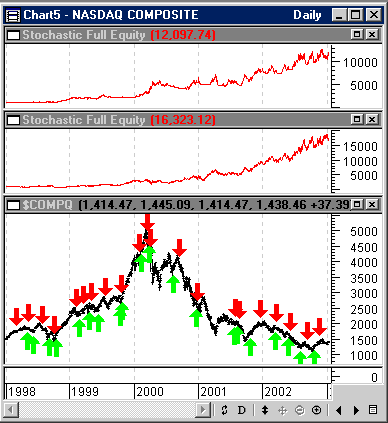
| Despite all these efforts you still have numerous drawdowns. Two possible solutions are: 1. If a trend is detected switch to another indicator. 2. If in a bear market ignore the long entry signals, and in a bull market ignore the short entry signals. |
 Figure 2: Nasdaq Composite daily price and equity performance with stops (top chart) and without (middle chart). Using the difference of two moving averages: new highs/(new highs + new lows), to declare a bull or bear market and then requiring that you be in a bull market for a long entry, or a bear market for short entry, equity performance is improved as can be seen by comparing the middle chart to the top chart. The top chart is the entire equity picture for Figure 1, while the middle chart has no stops and uses 52-week new highs and lows for a bull versus bear determination. Both equity charts start with $1,000, delay a day on entry signal, exit on the same day of signal, use 50% margin, and use all of your equity whenever a position is taken. I have a hard time using a system that says get out if you detect a trend because I believe that you are inherently in a high risk position if your system is looking for a clever exit as opposed to a solid entry. And that is what it really gets down to. You can argue about the different indicators but I would suggest the first thing you do is consider whether you are talking entry or exit. When I compare the equity performance I see better performance-- more profit with smaller drawdowns-- using the system that limited long entry to bull markets and short entry to bear markets (Figure 2: middle chart) than I do with the first system that used stop-losses to minimize the damage from bad entries (Figure 2: top chart). So while the conventional wisdom is to use stochastics only in a non-trending choppy market, you could use it for entry but condition the entry on whether the market is bullish or bearish. The system using bull/bear market determination had 21 winning trades, 17 losing ones, with the largest win = $3,817.42, largest loss = $1,131.00, was in the market all the time and used no stop-losses, with a ending profit of $15,463.38 from an initial equity of $1,000 put in the market 1/14/98. |
Market index trading on a daily basis.
| Title: | Staff Writer |
| Company: | Technical Analysis, Inc. |
| Address: | 4757 California Ave SW |
| Seattle, WA 98116-4499 | |
| Phone # for sales: | 206 938 0570 |
| Fax: | 206 938 1307 |
| Website: | www.traders.com |
| E-mail address: | dpeterson@traders.com |
Traders' Resource Links | |
| Charting the Stock Market: The Wyckoff Method -- Books | |
| Working-Money.com -- Online Trading Services | |
| Traders.com Advantage -- Online Trading Services | |
| Technical Analysis of Stocks & Commodities -- Publications and Newsletters | |
| Working Money, at Working-Money.com -- Publications and Newsletters | |
| Traders.com Advantage -- Publications and Newsletters | |
| Professional Traders Starter Kit -- Software | |
Click here for more information about our publications!
Comments
Date: 01/21/03Rank: 5Comment:
Date: 02/11/03Rank: 3Comment:

Request Information From Our Sponsors
- StockCharts.com, Inc.
- Candle Patterns
- Candlestick Charting Explained
- Intermarket Technical Analysis
- John Murphy on Chart Analysis
- John Murphy's Chart Pattern Recognition
- John Murphy's Market Message
- MurphyExplainsMarketAnalysis-Intermarket Analysis
- MurphyExplainsMarketAnalysis-Visual Analysis
- StockCharts.com
- Technical Analysis of the Financial Markets
- The Visual Investor
- VectorVest, Inc.
- Executive Premier Workshop
- One-Day Options Course
- OptionsPro
- Retirement Income Workshop
- Sure-Fire Trading Systems (VectorVest, Inc.)
- Trading as a Business Workshop
- VectorVest 7 EOD
- VectorVest 7 RealTime/IntraDay
- VectorVest AutoTester
- VectorVest Educational Services
- VectorVest OnLine
- VectorVest Options Analyzer
- VectorVest ProGraphics v6.0
- VectorVest ProTrader 7
- VectorVest RealTime Derby Tool
- VectorVest Simulator
- VectorVest Variator
- VectorVest Watchdog
