

HOT TOPICS LIST
- MACD
- Fibonacci
- RSI
- Gann
- ADXR
- Stochastics
- Volume
- Triangles
- Futures
- Cycles
- Volatility
- ZIGZAG
- MESA
- Retracement
- Aroon
INDICATORS LIST
LIST OF TOPICS
PRINT THIS ARTICLE
by Mark Rivest
Bearish momentum hints Amazon.com, Inc. could be ripe for a decline.
Position: N/A
Mark Rivest
Independent investment advisor, trader and writer. He has written articles for Technical Analysis of Stocks & Commodities, Traders.com Advantage,Futuresmag.com and, Finance Magnates. Author of website Four Dimension Trading.
PRINT THIS ARTICLE
MOMENTUM
Amazon Fatigue
05/13/21 02:32:31 PMby Mark Rivest
Bearish momentum hints Amazon.com, Inc. could be ripe for a decline.
Position: N/A
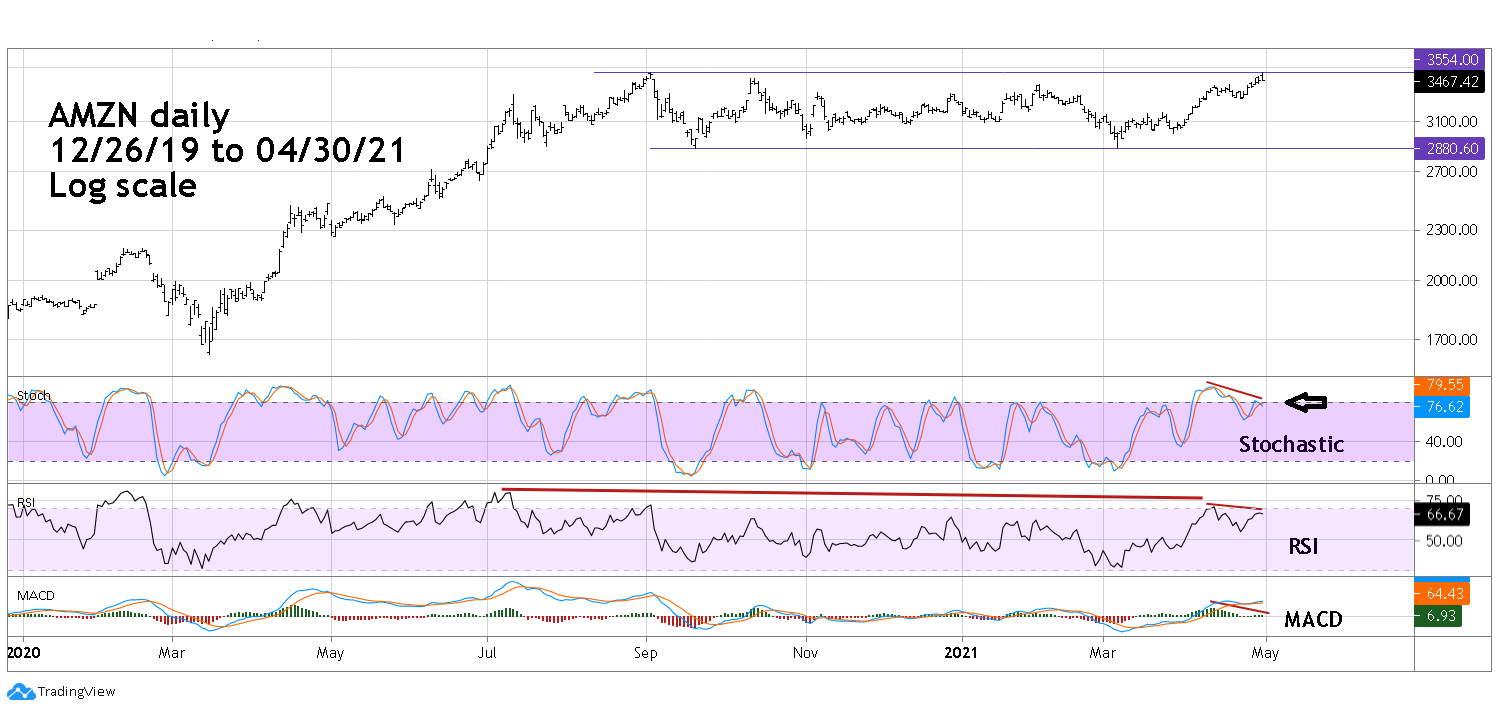
| Amazon.com, Inc (AMZN) is one of the top stocks in the Nasdaq Composite and one of the largest companies in the world. AMZN is normally a stock market leader yet from September 2, 2020 to April 30, 2021 its performance lagged the S&P 500 (SPX). AMZN's first fiscal quarters earnings report released on April 29, 2021 could be the catalyst for the stock to enter a multi-month decline. Amazon Momentum On April 29, 2021 AMZN released its first quarter earnings that crushed estimates. Revenue was up 44% and profits were up a staggering 224%. The next trading day AMZN went up and reached 3554.00, marginally above its all-time high achieve September 2, 2020. AMZN ended the session at 3467.42, down 3.89 from the prior day's close. From fundamental analysis, the stock's inability to sustain an up move on fantastic news is a bearish warning. The message from momentum indicators is even more bearish. Please see the daily AMZN chart illustrated in Figure 1. Daily Stochastics has a bearish divergence vs. the stock's mid-April high and the lines have a bearish crossover. RSI has a double bearish divergence vs. the momentum peak registered in early July 2020. The MACD Histogram has a bearish divergence. The combination of bearish divergences imply AMZN could be on the cusp of at least a multi-week drop. |
|
| Figure 1. The combination of bearish divergences imply AMZN could be on the cusp of at least a multi-week drop. |
| Graphic provided by: TradingView. |
| |
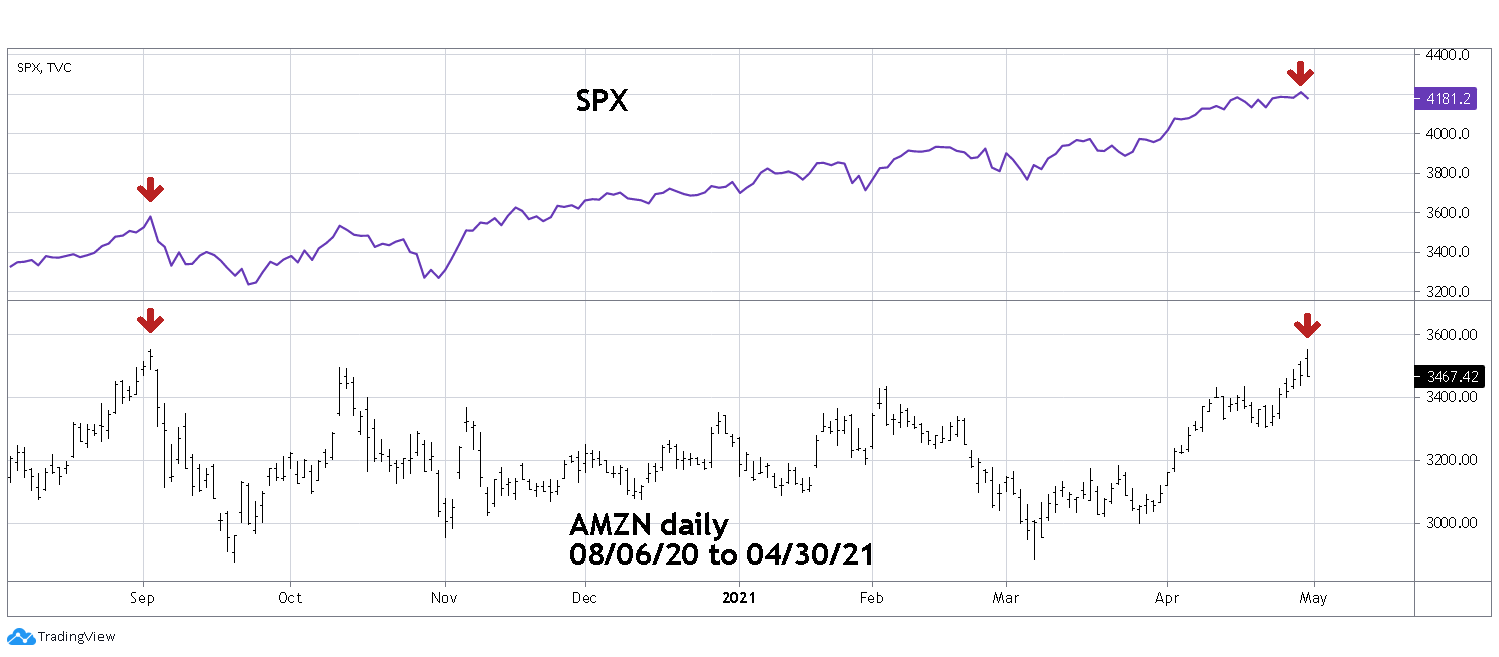
| Amazon vs. S&P 500 Please see the daily AMZN and SPX chart illustrated in Figure 2. In the Wall Street classic "How I Made $2,000,000 In The Stock Market" by Nicholas Darvas, the author make the case for buying stocks that are outperforming the broader market. The first step in this process is to examine stocks that are making new 52-week highs. From September 2, 2020 to April 29, 2021, not only did AMZN not make a new 52-week high, but through most of that time the SPX made new highs. From September 2, 2020 to April 30, 2021 the SPX gained 16.7%. AMZN over that same time lost 1.8%. This is another reason to suspect AMZN could be vulnerable to drop. |
|
| Figure 2. From September 2, 2020 to April 30, 2021 the SPX gained 16.7%, AMZN over that same time lost 1.8%. |
| Graphic provided by: TradingView. |
| |
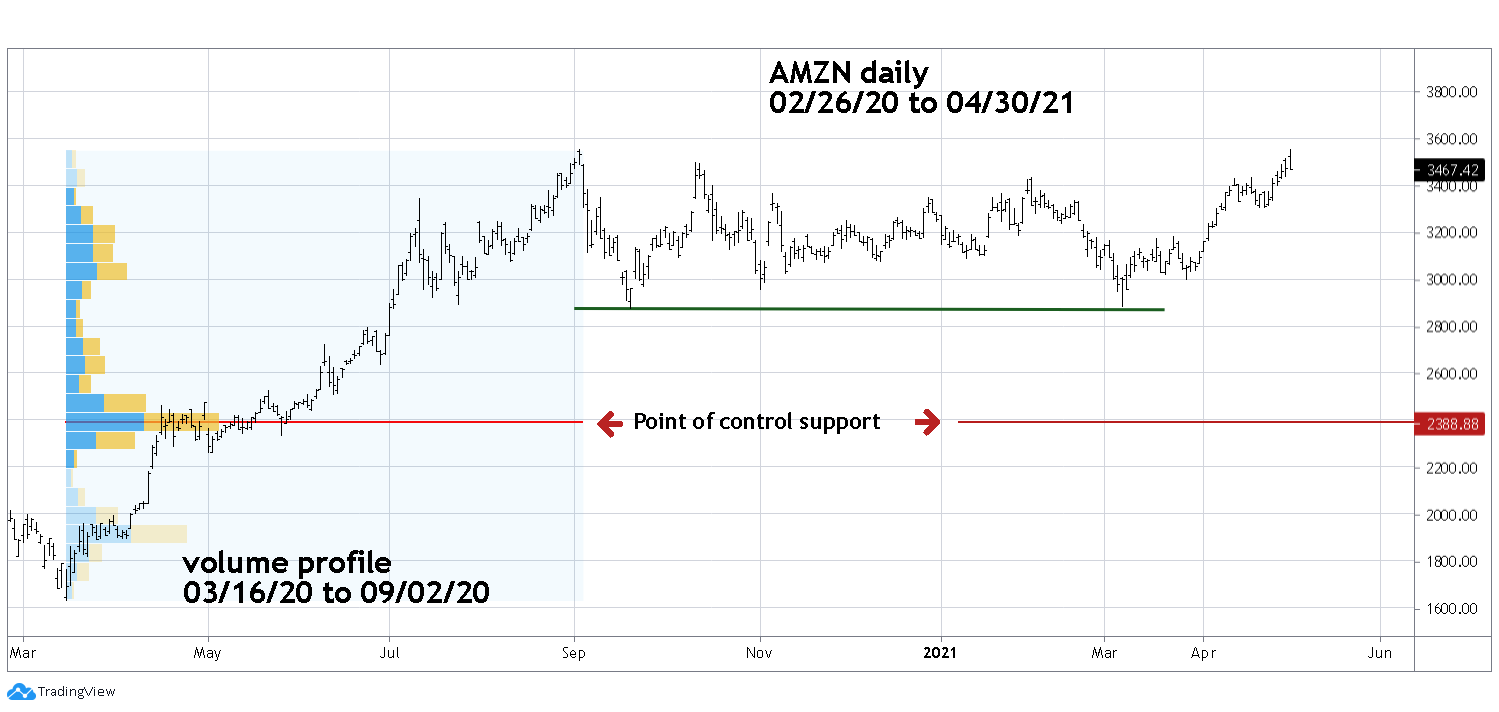
| Downside Potential The AMZN chart in Figure 1 shows the stock is in a sideways trend channel. The double bottom points are at 2871.00 and 2881.00 assuming AMZN breaks below 2871.00 where is the next significant support zone? Please see the daily AMZN Volume profile chart illustrated in Figure 3. Volume Profile takes the total volume traded at a specific price level during a specified time period. The widest part of the profile, called Point of control (POC), represents potential strong support/resistance. The Volume profile for the rally March 6, 2020 to September 2, 2020 has POC near 2388.00 and is an area where price could reach if AMZN breaks below 2871.00. |
|
| Figure 3. The widest part of the profile (Point of control (POC)) represents potential strong support/resistance. |
| Graphic provided by: TradingView. |
| |
| Summary Several momentum indicators imply at least a multi-week decline: AMZN has underperformed the SPX for several months. Very bullish news has failed to spur an immediate and strong rally. AMZN, as of late April 2021, appears to have made a classic double top with the September 2, 2020 peak and within two weeks could reach 2871.00. Because AMZN is an important Nasdaq Composite stock its decline could be a factor in that index's drop. Further Reading: Darvas Nicolas (1971) "How I Made $2,000,000 in the Stock Market" Lyle Stuart, Inc. |
Independent investment advisor, trader and writer. He has written articles for Technical Analysis of Stocks & Commodities, Traders.com Advantage,Futuresmag.com and, Finance Magnates. Author of website Four Dimension Trading.
| Website: | www.fourdimensiontrading.com |
| E-mail address: | markrivest@gmail.com |
Click here for more information about our publications!
Comments

Request Information From Our Sponsors
- StockCharts.com, Inc.
- Candle Patterns
- Candlestick Charting Explained
- Intermarket Technical Analysis
- John Murphy on Chart Analysis
- John Murphy's Chart Pattern Recognition
- John Murphy's Market Message
- MurphyExplainsMarketAnalysis-Intermarket Analysis
- MurphyExplainsMarketAnalysis-Visual Analysis
- StockCharts.com
- Technical Analysis of the Financial Markets
- The Visual Investor
- VectorVest, Inc.
- Executive Premier Workshop
- One-Day Options Course
- OptionsPro
- Retirement Income Workshop
- Sure-Fire Trading Systems (VectorVest, Inc.)
- Trading as a Business Workshop
- VectorVest 7 EOD
- VectorVest 7 RealTime/IntraDay
- VectorVest AutoTester
- VectorVest Educational Services
- VectorVest OnLine
- VectorVest Options Analyzer
- VectorVest ProGraphics v6.0
- VectorVest ProTrader 7
- VectorVest RealTime Derby Tool
- VectorVest Simulator
- VectorVest Variator
- VectorVest Watchdog