

HOT TOPICS LIST
- MACD
- Fibonacci
- RSI
- Gann
- ADXR
- Stochastics
- Volume
- Triangles
- Futures
- Cycles
- Volatility
- ZIGZAG
- MESA
- Retracement
- Aroon
INDICATORS LIST
LIST OF TOPICS
PRINT THIS ARTICLE
by Stella Osoba, CMT
The energy sector is currently the best preforming sector year-to-date, so now seems to be a good time to look at one of its components and compare its performance to both the sector and the S&P 500 index.
Position: N/A
Stella Osoba, CMT
Stella Osoba is a trader and financial writer. She is a frequent contributor to "Technical Analysis of Stocks and Commodities" magazine and "Traders.com Advantage" as well as other financial publications.
PRINT THIS ARTICLE
TECHNICAL ANALYSIS
Penn Virginia Corp.
04/01/21 02:09:50 PMby Stella Osoba, CMT
The energy sector is currently the best preforming sector year-to-date, so now seems to be a good time to look at one of its components and compare its performance to both the sector and the S&P 500 index.
Position: N/A
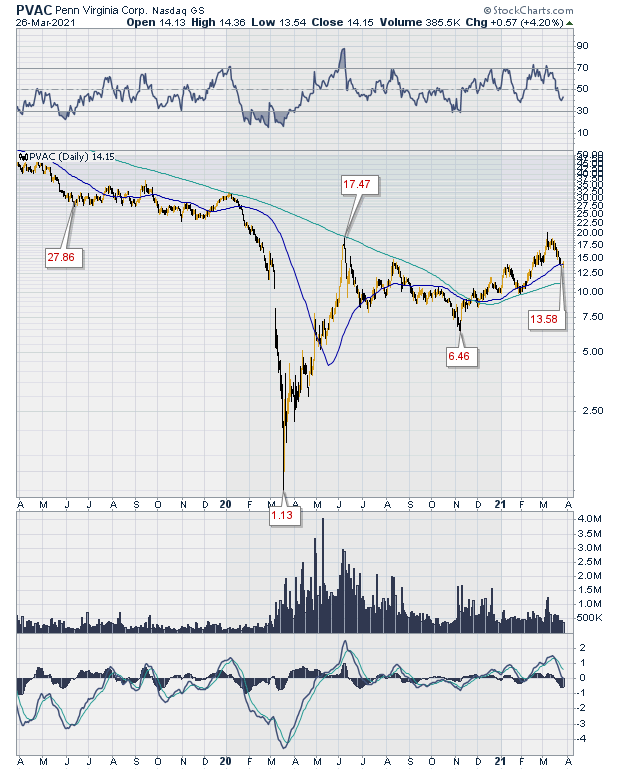
| Penn Virginia Corp. (PVAC) is a small cap oil and gas company. The stock has recently completed a sideways basing pattern, see Figure 1. |
|
| Figure 1. Daily chart for PVAC. |
| Graphic provided by: StockCharts.com. |
| |
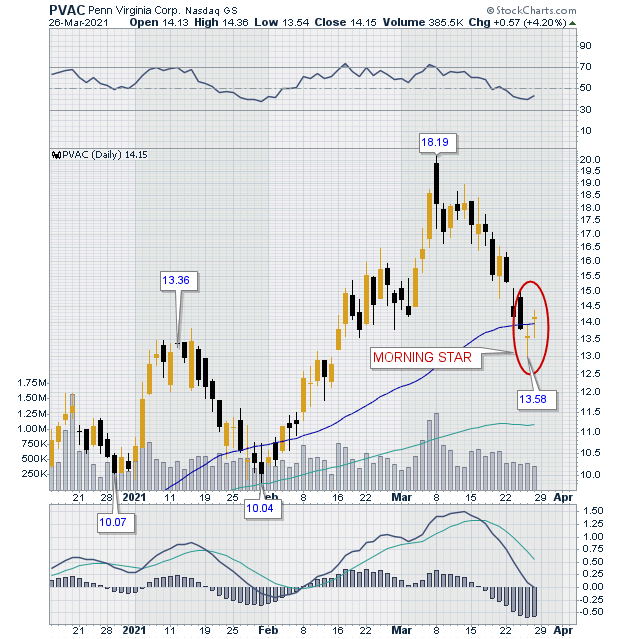
| PVAC caught my eye because it recently completed a Morning Star. A Morning Star is a three-day candlestick reversal pattern. It consists of a bearish candle on day one. A star formation on the second day with a gap down on the open. The third day is a bullish candle with a gap up on the open and a close around the half way point or higher of the body of the first candle in the pattern. In our case the candle on the third day is a doji, but its gap up and close near the middle of the day one candle allows the pattern to pass as a Morning Star (See Figure 2). |
|
| Figure 2. Morning star pattern on PVAC daily chart. |
| Graphic provided by: StockCharts.com. |
| |
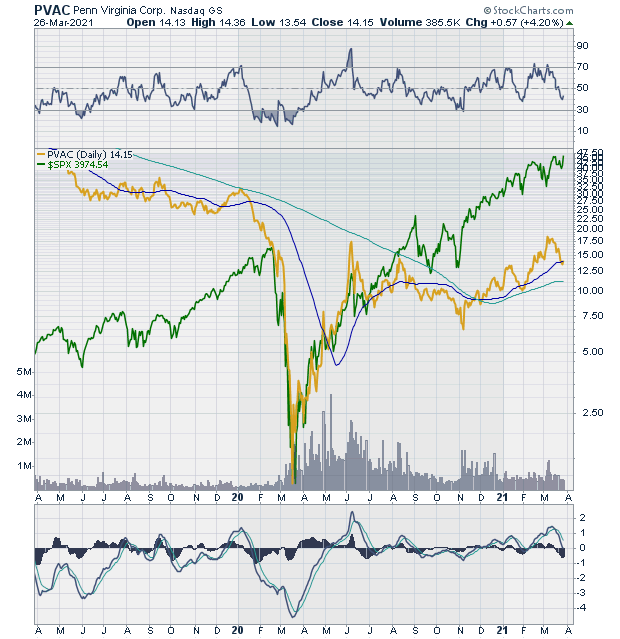
| Figure 2 shows PVAC's steep downtrend to close just below its 50-day moving average (second day of the Morning Star pattern). The morning star reversal pattern is a signal that the next move for prices is likely to be higher. If we anticipate a likely reversal in prices, how does PVAC compare to 1) the broader market and 2) its sector? Figure 3 is a line chart of PVAC (gold line), superimposed over a line chart of the S&P 500 index. While the S&P 500 index continues to march higher, clocking ever new highs, PVAC has just completed its basing pattern and sits near its 50-day moving average which has begun to curve upwards. The 50-day moving average is also above its longer term 200-day moving average, which is bullish. |
|
| Figure 3. PVAC vs. $SPX. |
| Graphic provided by: StockCharts.com. |
| |
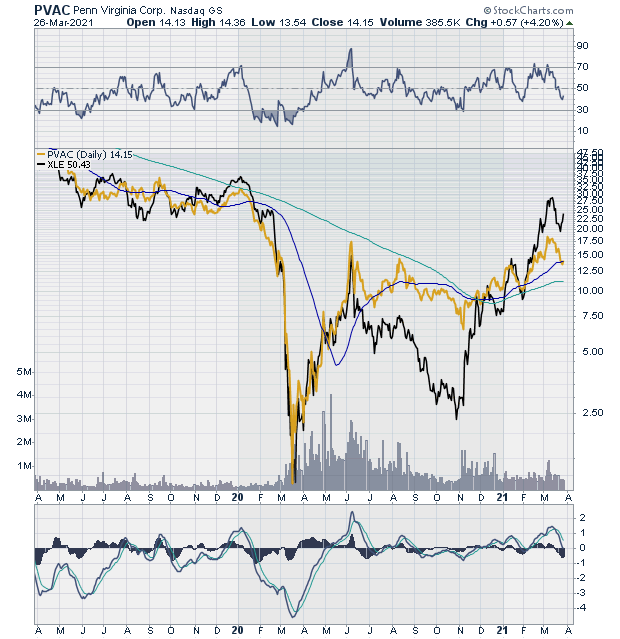
| The second comparison is with its sector index. Figure 4 is a line chart of PVAC (gold line) superimposed over a line chart of the Energy Select Sector SPDR Fund (XLE). While the chart shows that neither the sector nor the stock have yet made new highs, it is clear that the charts are trending bullish. From early February to early March XLE put in a strong bullish showing, then paused. Its correction coincided with that of PVAC. But XLE recovery from the correction was earlier. PVAC is lagging the index, but only just slightly. Its chart is showing strength and may move in line with its sector. |
|
| Figure 4. PVAC vs. XLE. |
| Graphic provided by: StockCharts.com. |
| |
| There are different ways to trade a Morning Star pattern. The pattern is not complete until the third day. The support area of this pattern is the lowest low of the three candles that form the pattern. This leads some traders, depending on their risk appetite, to wait until a retest of the lows of the pattern to enter the trade on the long side. Note: This article is meant for educational purposes only. It is important to do your own research and analysis in all circumstances. |
Stella Osoba is a trader and financial writer. She is a frequent contributor to "Technical Analysis of Stocks and Commodities" magazine and "Traders.com Advantage" as well as other financial publications.
| E-mail address: | stellaosoba@gmail.com |
Click here for more information about our publications!
PRINT THIS ARTICLE

Request Information From Our Sponsors
- StockCharts.com, Inc.
- Candle Patterns
- Candlestick Charting Explained
- Intermarket Technical Analysis
- John Murphy on Chart Analysis
- John Murphy's Chart Pattern Recognition
- John Murphy's Market Message
- MurphyExplainsMarketAnalysis-Intermarket Analysis
- MurphyExplainsMarketAnalysis-Visual Analysis
- StockCharts.com
- Technical Analysis of the Financial Markets
- The Visual Investor
- VectorVest, Inc.
- Executive Premier Workshop
- One-Day Options Course
- OptionsPro
- Retirement Income Workshop
- Sure-Fire Trading Systems (VectorVest, Inc.)
- Trading as a Business Workshop
- VectorVest 7 EOD
- VectorVest 7 RealTime/IntraDay
- VectorVest AutoTester
- VectorVest Educational Services
- VectorVest OnLine
- VectorVest Options Analyzer
- VectorVest ProGraphics v6.0
- VectorVest ProTrader 7
- VectorVest RealTime Derby Tool
- VectorVest Simulator
- VectorVest Variator
- VectorVest Watchdog