

HOT TOPICS LIST
- MACD
- Fibonacci
- RSI
- Gann
- ADXR
- Stochastics
- Volume
- Triangles
- Futures
- Cycles
- Volatility
- ZIGZAG
- MESA
- Retracement
- Aroon
INDICATORS LIST
LIST OF TOPICS
PRINT THIS ARTICLE
by Stella Osoba, CMT
Poles are Point and Figure reversal patterns. They are never continuation patterns. It is useful to understand how they work because they often present the knowledgable trader opportunities to enter or exit a trade before a price reversal.
Position: N/A
Stella Osoba, CMT
Stella Osoba is a trader and financial writer. She is a frequent contributor to "Technical Analysis of Stocks and Commodities" magazine and "Traders.com Advantage" as well as other financial publications.
PRINT THIS ARTICLE
POINT & FIGURE
Point & Figure Poles
03/25/21 05:02:23 PMby Stella Osoba, CMT
Poles are Point and Figure reversal patterns. They are never continuation patterns. It is useful to understand how they work because they often present the knowledgable trader opportunities to enter or exit a trade before a price reversal.
Position: N/A
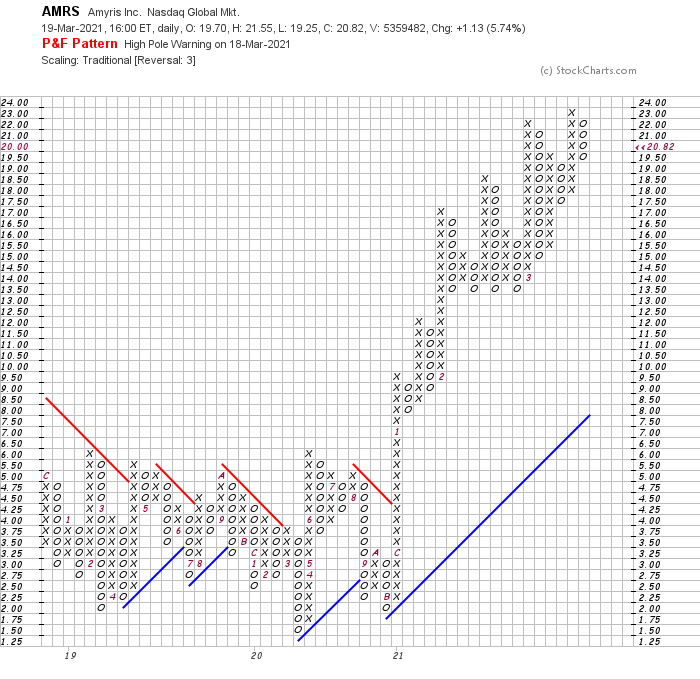
| A pole is a long column of X's or O's with a reverse column beside it. P&F charting recognizes two main types of poles. The pole which forms in an uptrend is termed a high pole. When the pole is forming, but before it is completed, it is known as a high pole warning. When it is completed the pattern becomes a high pole reversal. The reverse is true in downtrends. When the pole is forming it is known as a low pole warning and when the pattern is completed it becomes a low pole reversal. |
| Amyris Inc. (AMRS) is a small cap biotechnology company. It's P&F chart will illustrate a high pole warning. The pattern is not complete as of the time of this writing. After a multi-year period of consolidation as price traded within a narrow range, the breakout finally came in December 2020 and AMRS entered an impressive uptrend (See Figure 1). During this period price continued to make higher highs, with multiple buy signals and no significant sell signals registering on the chart. The high pole warning came on March 18, 2021 when price reversed by over 50% of the previous column of X's. |
|
| Figure 1. P&F chart for AMRS. |
| Graphic provided by: StockCharts.com. |
| |
| There are some conditions which must be met before a pole can be considered a reversal: There must be some sideways consolidation prior to the formation of the pole. Price rises, then enters a period of consolidation, price then breaks out (above in the case of a high pole) and a long column of X's is created. This column of X's must exceed the previous column by at least three boxes, but to avoid the risk of a failed pattern, it is preferable that it exceeds the previous column by 5 or more boxes. After the long column of X's has completed forming, the very next column which will be O's will retrace the prior column of X's by at least 50%. At this point we have a high pole warning. |
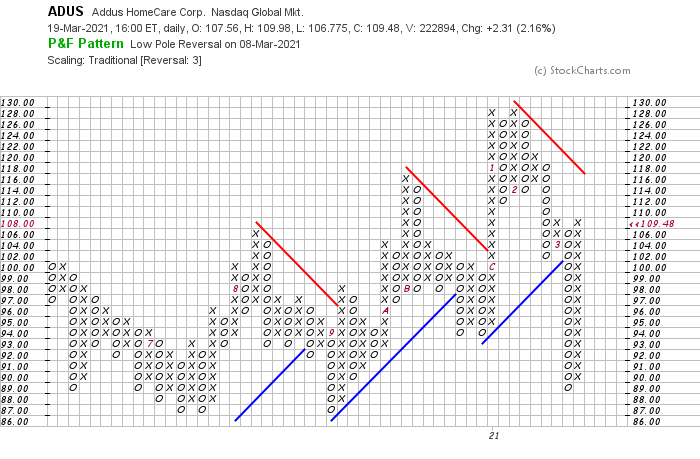
| As with all technical analysis patterns and signals, all will fail some of the time. For the pattern to be complete let us see what it looks like in reverse. A low pole reversal is found in down trends and signals a reversal to the upside. Addus HomeCare Corp. (ADUS) is a small cap company in the Health Care sector (See Figure 2). It entered a steep downtrend in February of 2021. As we can see the long column of O's on the chart is reversed completely by the next column of X's. While it is clear that price reversed from the downtrend, a further period of consolidation may occur before price breaks out and gives a clear buy signal. |
|
| Figure 2. P&F chart for ADUS. |
| Graphic provided by: StockCharts.com. |
| |
| While poles can be very easy to spot on a historical chart, they can in fact be difficult and dangerous to trade especially during periods of volatile price movements. Historical charts remove the one element that traders must learn to master — uncertainty. |
Stella Osoba is a trader and financial writer. She is a frequent contributor to "Technical Analysis of Stocks and Commodities" magazine and "Traders.com Advantage" as well as other financial publications.
| E-mail address: | stellaosoba@gmail.com |
Click here for more information about our publications!
Comments
Date:�03/30/21Rank:�5Comment:�Great work and easy to understand.

Request Information From Our Sponsors
- StockCharts.com, Inc.
- Candle Patterns
- Candlestick Charting Explained
- Intermarket Technical Analysis
- John Murphy on Chart Analysis
- John Murphy's Chart Pattern Recognition
- John Murphy's Market Message
- MurphyExplainsMarketAnalysis-Intermarket Analysis
- MurphyExplainsMarketAnalysis-Visual Analysis
- StockCharts.com
- Technical Analysis of the Financial Markets
- The Visual Investor
- VectorVest, Inc.
- Executive Premier Workshop
- One-Day Options Course
- OptionsPro
- Retirement Income Workshop
- Sure-Fire Trading Systems (VectorVest, Inc.)
- Trading as a Business Workshop
- VectorVest 7 EOD
- VectorVest 7 RealTime/IntraDay
- VectorVest AutoTester
- VectorVest Educational Services
- VectorVest OnLine
- VectorVest Options Analyzer
- VectorVest ProGraphics v6.0
- VectorVest ProTrader 7
- VectorVest RealTime Derby Tool
- VectorVest Simulator
- VectorVest Variator
- VectorVest Watchdog