

HOT TOPICS LIST
- MACD
- Fibonacci
- RSI
- Gann
- ADXR
- Stochastics
- Volume
- Triangles
- Futures
- Cycles
- Volatility
- ZIGZAG
- MESA
- Retracement
- Aroon
INDICATORS LIST
LIST OF TOPICS
PRINT THIS ARTICLE
by Stella Osoba, CMT
The most important thing we as traders do is determine the next probable move in prices. With this in mind, let's take a look at Grubhub Inc. (GRUB).
Position: N/A
Stella Osoba, CMT
Stella Osoba is a trader and financial writer. She is a frequent contributor to "Technical Analysis of Stocks and Commodities" magazine and "Traders.com Advantage" as well as other financial publications.
PRINT THIS ARTICLE
TECHNICAL ANALYSIS
Does This Chart Look Bearish?
02/25/21 12:37:37 PMby Stella Osoba, CMT
The most important thing we as traders do is determine the next probable move in prices. With this in mind, let's take a look at Grubhub Inc. (GRUB).
Position: N/A
| GRUB is a mobile and online platform connecting more than 225,000 restaurants with nearly 28 million active diners in over 4,000 cities across the United States. Its shares debuted on the NYSE on April 4, 2014. |
|
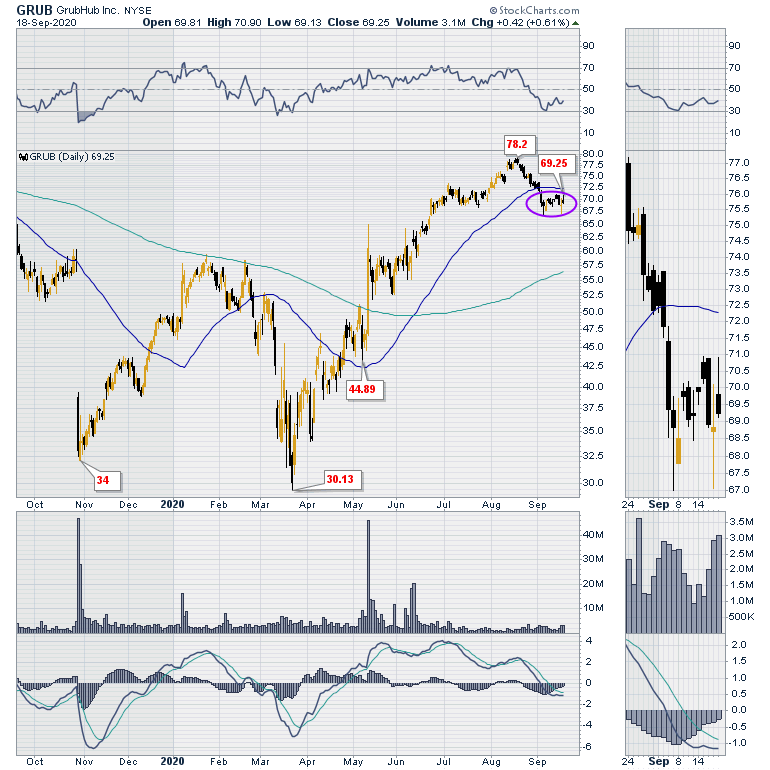
| Figure 1. Daily chart for GRUB. |
| Graphic provided by: StockCharts.com. |
| |
| Figure 1 is a daily chart of GRUB. After its steep decline in March 2020 which was in line with the market, GRUB's shares had been in an uptrend until mid August 2020. On August 18, 2020 shares traded at a high of $79.11 before a reaction set in. Figure 1 shows the decline has pulled shares below its 50-day moving average. Over the two weeks ending in September 18, 2020, shares have struggled unsuccessfully to rise above the 50-day moving average and are currently seemingly in a holding pattern. The thumbnail shows the last two weeks of price action in more detail. So the question to be answered is, does this chart look bearish? |
|
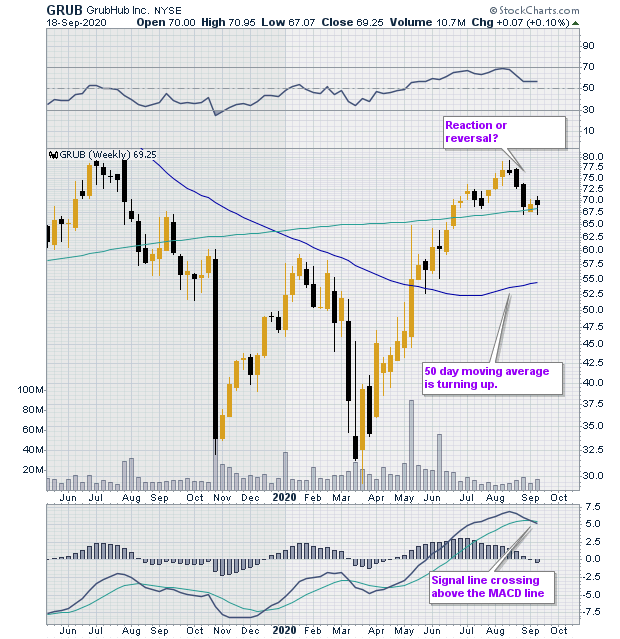
| Figure 2. Weekly chart for GRUB. |
| Graphic provided by: StockCharts.com. |
| |
| Before we answer, let's look at Figure 2 which is a weekly chart of GRUB. The advantage of weekly charts is that it allows us to see more price action and therefore deepen our analysis. We can see that after a decline, GRUB formed a double bottom and completed a strong trend up before the current price reaction set in. |
| While price has broken below the 50-day moving average on the daily price chart, which is a bearish signal, on the weekly chart, though price is below the 50-day moving average, it has turned upwards and that is bullish. The last two weeks of price action show that price has found short term support at the 200-day moving average which is still above the 50-day moving average. The RSI displayed in the panel above price is higher than 50 while the MACD which is in the panel below price is above 0, also bullish. (Note however that the signal line is crossing above the MACD line which is likely shorter-term bearish). |
| The weight of the evidence suggests that we are likely to be witnessing a reaction rather than a reversal in the stock price. While the daily short-term chart is clearly bearish, the weekly is less so. A further pullback (not shown) will reveal that GRUB is recovering from a deep downtrend which set in on September 14, 2018 when the stock price reached a high of $149.35. The downtrend culminated in the stock forming a double bottom from which the current uptrend was born. A note of caution: even if a stock's price action looks healthy, it is not divorced from what is happening in the wider market. When the market as a whole turns down, even well performing stocks are likely to follow. |
Stella Osoba is a trader and financial writer. She is a frequent contributor to "Technical Analysis of Stocks and Commodities" magazine and "Traders.com Advantage" as well as other financial publications.
| E-mail address: | stellaosoba@gmail.com |
Click here for more information about our publications!
PRINT THIS ARTICLE

Request Information From Our Sponsors
- StockCharts.com, Inc.
- Candle Patterns
- Candlestick Charting Explained
- Intermarket Technical Analysis
- John Murphy on Chart Analysis
- John Murphy's Chart Pattern Recognition
- John Murphy's Market Message
- MurphyExplainsMarketAnalysis-Intermarket Analysis
- MurphyExplainsMarketAnalysis-Visual Analysis
- StockCharts.com
- Technical Analysis of the Financial Markets
- The Visual Investor
- VectorVest, Inc.
- Executive Premier Workshop
- One-Day Options Course
- OptionsPro
- Retirement Income Workshop
- Sure-Fire Trading Systems (VectorVest, Inc.)
- Trading as a Business Workshop
- VectorVest 7 EOD
- VectorVest 7 RealTime/IntraDay
- VectorVest AutoTester
- VectorVest Educational Services
- VectorVest OnLine
- VectorVest Options Analyzer
- VectorVest ProGraphics v6.0
- VectorVest ProTrader 7
- VectorVest RealTime Derby Tool
- VectorVest Simulator
- VectorVest Variator
- VectorVest Watchdog