HOT TOPICS LIST
- MACD
- Fibonacci
- RSI
- Gann
- ADXR
- Stochastics
- Volume
- Triangles
- Futures
- Cycles
- Volatility
- ZIGZAG
- MESA
- Retracement
- Aroon
INDICATORS LIST
LIST OF TOPICS
PRINT THIS ARTICLE
by Stella Osoba, CMT
With the madness surrounding stocks like GME, it seems that now is a good time to go over this basic principle of trend trading.
Position: N/A
Stella Osoba, CMT
Stella Osoba is a trader and financial writer. She is a frequent contributor to "Technical Analysis of Stocks and Commodities" magazine and "Traders.com Advantage" as well as other financial publications.
PRINT THIS ARTICLE
TECHNICAL ANALYSIS
The Time To Short A Stock Is Not When It's In An Uptrend
02/11/21 02:22:24 PMby Stella Osoba, CMT
With the madness surrounding stocks like GME, it seems that now is a good time to go over this basic principle of trend trading.
Position: N/A
| We all want to believe we have an edge and that often means that we convince ourselves we see or know something that others have missed. But a good principle to follow is as the title of this short article says, the time to short a stock is not when it is in an uptrend. Instead of constantly guessing what the stock or stock market will do next, simply go with the trend. |
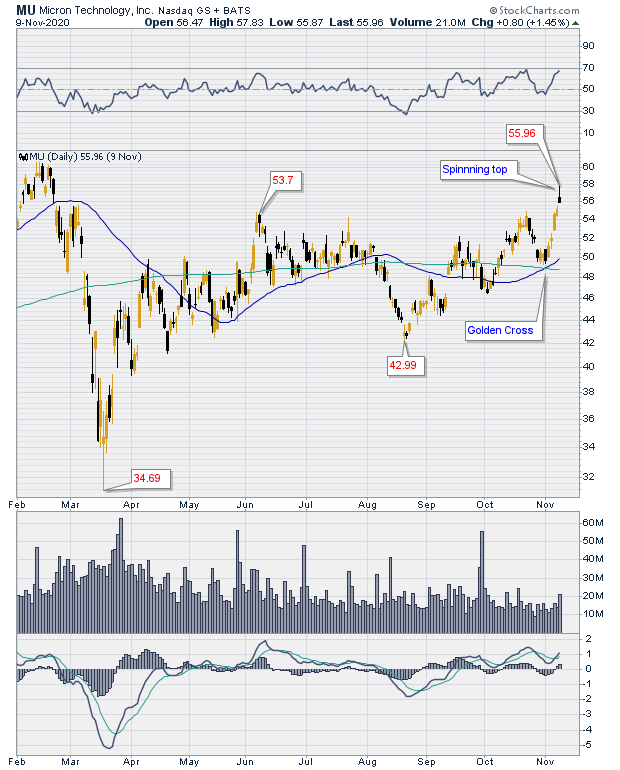
| For illustrative purposes, let's take a look at the chart of Micron Technology, Inc. (MU). Figure 1 shows MU trading above its recent low of $34.69. It traded sideways for several months as accumulation was taking place, dipped to a higher low of $42.99 and proceeded to form a new trend. The gap up on September 14, 2020 might have been a clue as to the change in trend, as might have been the golden cross (marked on Figure 1). A golden cross forms when the 50-day moving average crosses above the 200-day moving average. |

|
| Figure 1. Daily chart for MU 11/9/2020. |
| Graphic provided by: StockCharts.com. |
| |
| The golden cross acted as support as price reacted to just above this level and then proceeded to rise. Figure 1 shows a spinning top form as price closes above the previous high. To a contrarian, this bearish signal might have sounded alarms. But reread the title of the article. Once we have determined that MU is in an uptrend, the time to short is not now. There needs to be more evidence that the new trend has in fact reversed. |

|
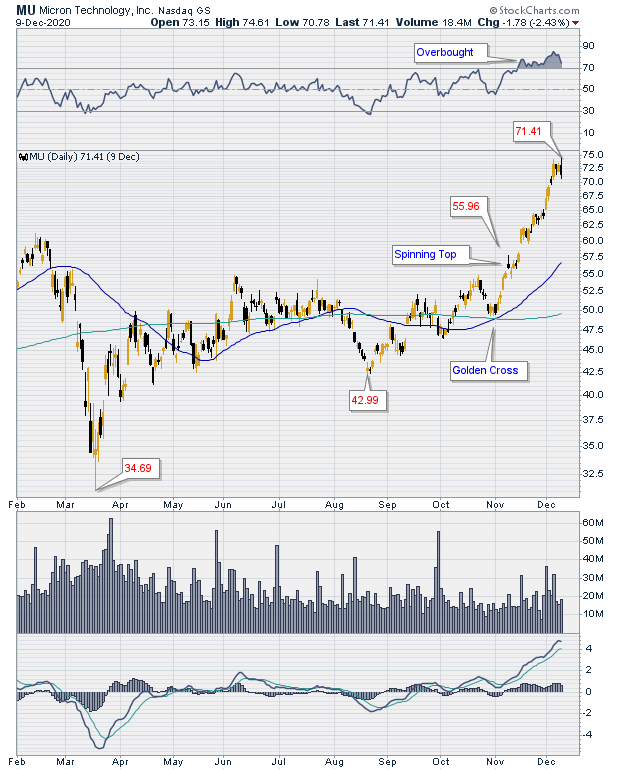
| Figure 2. Daily chart for MU 12/9/2020. |
| Graphic provided by: StockCharts.com. |
| |
| Figure 2 shows what would have happened if you had allowed yourself to get shaken out of your long position. The spinning top did not result in a trend reversal. After two days of sideways trading, price quickly begins to rise and then gaps up, showing that the uptrend is still in effect and is strong. A short on the spinning top as a signal would have quickly resulted in losses. |

|
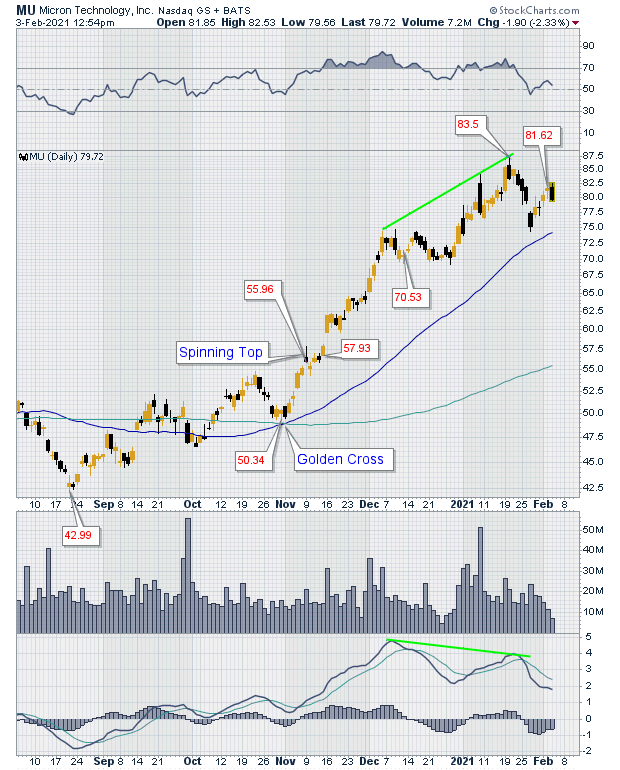
| Figure 3. Daily chart for MU 2/3/2021. |
| Graphic provided by: StockCharts.com. |
| |
| After a strong move up, price began to trade sideways. Looking at the chart and the distance price has moved from the 50-day moving average (see Figure 2), it might be tempting here to put on your contrarian hat once again, exit your position and maybe even attempt a short trade. But would this be wise? Figure 3 shows that after a quick sideways move, there was indeed a reaction but not one deep enough to dislodge the current trend. The uptrend still continued after the reaction completed its move and prices proceeded higher still. A negative divergence appears in Figure 3. A negative divergence can be bearish. So once again, you must pay attention for signals from price that the uptrend is not only weakening, but is also reversing before a short position would make sense. |
Stella Osoba is a trader and financial writer. She is a frequent contributor to "Technical Analysis of Stocks and Commodities" magazine and "Traders.com Advantage" as well as other financial publications.
| E-mail address: | stellaosoba@gmail.com |
Click here for more information about our publications!
PRINT THIS ARTICLE

|

Request Information From Our Sponsors
- VectorVest, Inc.
- Executive Premier Workshop
- One-Day Options Course
- OptionsPro
- Retirement Income Workshop
- Sure-Fire Trading Systems (VectorVest, Inc.)
- Trading as a Business Workshop
- VectorVest 7 EOD
- VectorVest 7 RealTime/IntraDay
- VectorVest AutoTester
- VectorVest Educational Services
- VectorVest OnLine
- VectorVest Options Analyzer
- VectorVest ProGraphics v6.0
- VectorVest ProTrader 7
- VectorVest RealTime Derby Tool
- VectorVest Simulator
- VectorVest Variator
- VectorVest Watchdog
- StockCharts.com, Inc.
- Candle Patterns
- Candlestick Charting Explained
- Intermarket Technical Analysis
- John Murphy on Chart Analysis
- John Murphy's Chart Pattern Recognition
- John Murphy's Market Message
- MurphyExplainsMarketAnalysis-Intermarket Analysis
- MurphyExplainsMarketAnalysis-Visual Analysis
- StockCharts.com
- Technical Analysis of the Financial Markets
- The Visual Investor
