HOT TOPICS LIST
- MACD
- Fibonacci
- RSI
- Gann
- ADXR
- Stochastics
- Volume
- Triangles
- Futures
- Cycles
- Volatility
- ZIGZAG
- MESA
- Retracement
- Aroon
INDICATORS LIST
LIST OF TOPICS
PRINT THIS ARTICLE
by Stella Osoba, CMT
Since touching a high of $67.61 on January 20, 2020, Intel Corp.(INTC) has been in a downtrend. This DOW behemoth, founded in 1968 may be down but is it out? Let's study some charts.
Position: N/A
Stella Osoba, CMT
Stella Osoba is a trader and financial writer. She is a frequent contributor to "Technical Analysis of Stocks and Commodities" magazine and "Traders.com Advantage" as well as other financial publications.
PRINT THIS ARTICLE
TECHNICAL ANALYSIS
Down But Maybe Not Out
12/23/20 01:48:50 PMby Stella Osoba, CMT
Since touching a high of $67.61 on January 20, 2020, Intel Corp.(INTC) has been in a downtrend. This DOW behemoth, founded in 1968 may be down but is it out? Let's study some charts.
Position: N/A
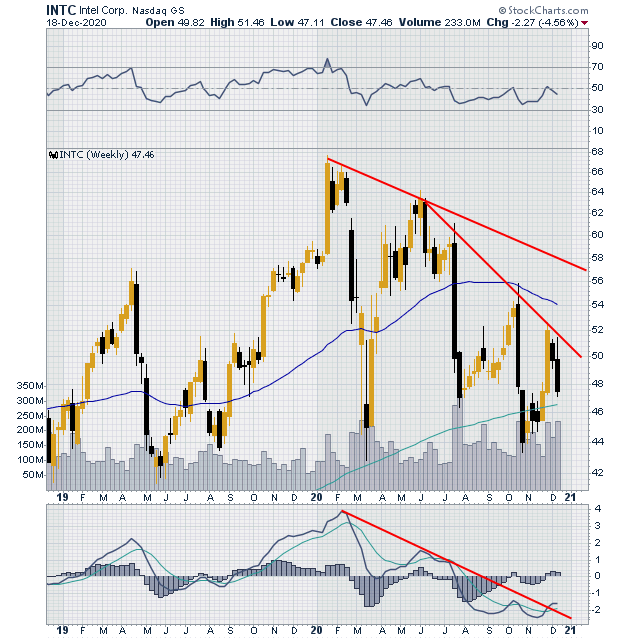
| Figure 1 is a weekly chart of INTC. It clearly shows the current downtrend with price accelerating down from about June 2020. The accelerating price decline allows us to draw a steeper trend line as price makes lower lows and lower highs (see red lines on Figure 1). Also note that the MACD displayed in the panel below price is confirming the downtrend as it makes lower highs. The signal line which is the light green line (slower) trades above the MACD line which is the gray line (faster) and is also confirming the current price trend. |

|
| Figure 1. Weekly chart for INTC. |
| Graphic provided by: StockCharts.com. |
| |
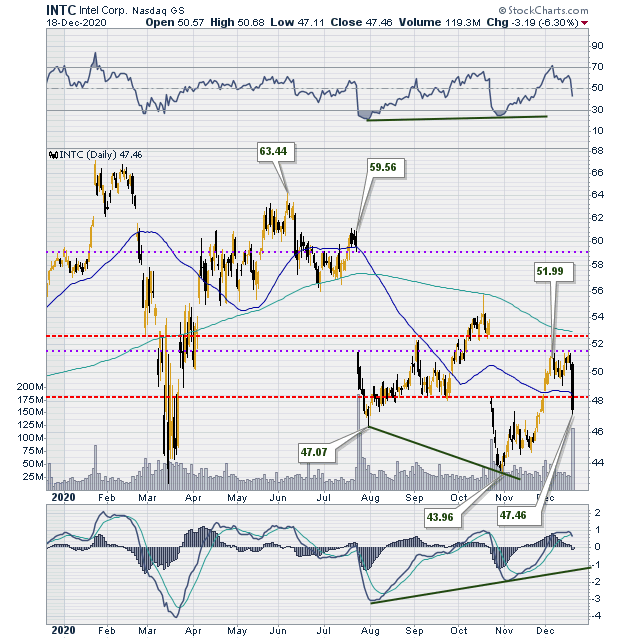
| Figure 2 is a daily chart of INTC, allowing us to get a closer look at price action. Note the two large gap downs highlighted on the chart. The first gap down is delineated by dashed purple lines while the second gap down is delineated by red dashed lines. The whole area of the downward gap will act as future resistance in a downtrend. After the first gap (dashed purple lines), price traded below and within the area of the gap for a couple of months, with the 200-day moving average acting as resistance to price's attempt to move beyond the middle of the resistance area. That effort failed spectacularly and gave up any gains gapping down a second time (red dashed lines). |

|
| Figure 2. Daily chart for INTC. |
| Graphic provided by: StockCharts.com. |
| |
| Price attempted to recover from this second gap after finding a low at around $43.96 in November 2020. It traded sideways and then recovered some of its losses to form a second sideways trading pattern within the halfway point of the second gap. But any recovery was short-lived when news that Microsoft was working on developing its own microprocessors for some of its servers broke. Price formed a strong bearish candle on high volume to close at $47.46. |
| So is INTC out? Not necessarily. While it is too soon to tell how long this current trend will last, green shoots of optimism are to be found in the positive divergence price has formed with the MACD. While price is making lower lows, the MACD is not confirming. This could be signs that price has reached its lows and is due for rebound. But the gaps are still unfilled and remain areas of significant resistance until they are in fact filled. INTC is a large capitalization stock and a DOW component. It has been around a long time. It is a stock worth watching. |
Stella Osoba is a trader and financial writer. She is a frequent contributor to "Technical Analysis of Stocks and Commodities" magazine and "Traders.com Advantage" as well as other financial publications.
| E-mail address: | stellaosoba@gmail.com |
Click here for more information about our publications!
PRINT THIS ARTICLE

Request Information From Our Sponsors
- StockCharts.com, Inc.
- Candle Patterns
- Candlestick Charting Explained
- Intermarket Technical Analysis
- John Murphy on Chart Analysis
- John Murphy's Chart Pattern Recognition
- John Murphy's Market Message
- MurphyExplainsMarketAnalysis-Intermarket Analysis
- MurphyExplainsMarketAnalysis-Visual Analysis
- StockCharts.com
- Technical Analysis of the Financial Markets
- The Visual Investor
- VectorVest, Inc.
- Executive Premier Workshop
- One-Day Options Course
- OptionsPro
- Retirement Income Workshop
- Sure-Fire Trading Systems (VectorVest, Inc.)
- Trading as a Business Workshop
- VectorVest 7 EOD
- VectorVest 7 RealTime/IntraDay
- VectorVest AutoTester
- VectorVest Educational Services
- VectorVest OnLine
- VectorVest Options Analyzer
- VectorVest ProGraphics v6.0
- VectorVest ProTrader 7
- VectorVest RealTime Derby Tool
- VectorVest Simulator
- VectorVest Variator
- VectorVest Watchdog
