HOT TOPICS LIST
- MACD
- Fibonacci
- RSI
- Gann
- ADXR
- Stochastics
- Volume
- Triangles
- Futures
- Cycles
- Volatility
- ZIGZAG
- MESA
- Retracement
- Aroon
INDICATORS LIST
LIST OF TOPICS
PRINT THIS ARTICLE
by Fawad Razaqzada
It is worth keeping a close eye on stocks in the renewable energy sector as the race towards cleaner energy intensifies.
Position: N/A
Fawad Razaqzada
Fawad Razaqzada is an experienced analyst and economist having been involved in the financial markets since 2010 working for leading global FX and CFD brokerages. Having graduated with a degree in economics and leveraging years of financial market experience, Fawad provides retail and professional traders worldwide with succinct fundamental & technical analysis. In addition, he also offers premium trade signals to subscribers, and trading education to help shorten the learning curves of developing traders. He has also been trading on his personal account for many years. Follow Fawad on twitter @Trader_F_R or visit his website at TradingCandles.com.
PRINT THIS ARTICLE
Canadian Solar Among Clean Energy Stocks To Watch
12/03/20 04:04:21 PMby Fawad Razaqzada
It is worth keeping a close eye on stocks in the renewable energy sector as the race towards cleaner energy intensifies.
Position: N/A
| Several European countries, including the UK, are committed to becoming the leaders in cleaner energy, while China has pledged a green revolution and wants to become carbon neutral by 2060. In the US, one of the four top priorities for the President-elect Joe Biden is tackling climate change. As such, Biden's victory has provided an additional boost to shares of renewable and cleaner energy companies. Biden has pledged to re-join the Paris climate agreement, and reverse some of the other controversial plans that the Trump administration had taken, including weakening automotive and appliance efficiency standards. |
| In addition to solar and wind power, it is worth keeping an eye on shares of companies that provide energy storage and grid infrastructure, as well as those that own or are large shareholders in such companies. One way to get onboard the solar rally and without worrying too much about company-specific risks at the same time is through an exchange-traded fund such as the Invesco Solar ETF. This ETF has a trading symbol "TAN," and consists of a basket of more than 20 global solar companies, providing you a good exposure to the sector. |
| You also have JinkoSolar Holding (JKS), which is a Chinese-based manufacturer of solar panels — currently the world's largest. The company distributes its solar products and sells to a utility, commercial and residential customer base all over the world including China, Japan, Europe, Latin America and USA. Other major stocks in the sector include: SunPower Corp (SPWR), SolarEdge Technologies (SEDG) and Enphase Energy (ENP). |
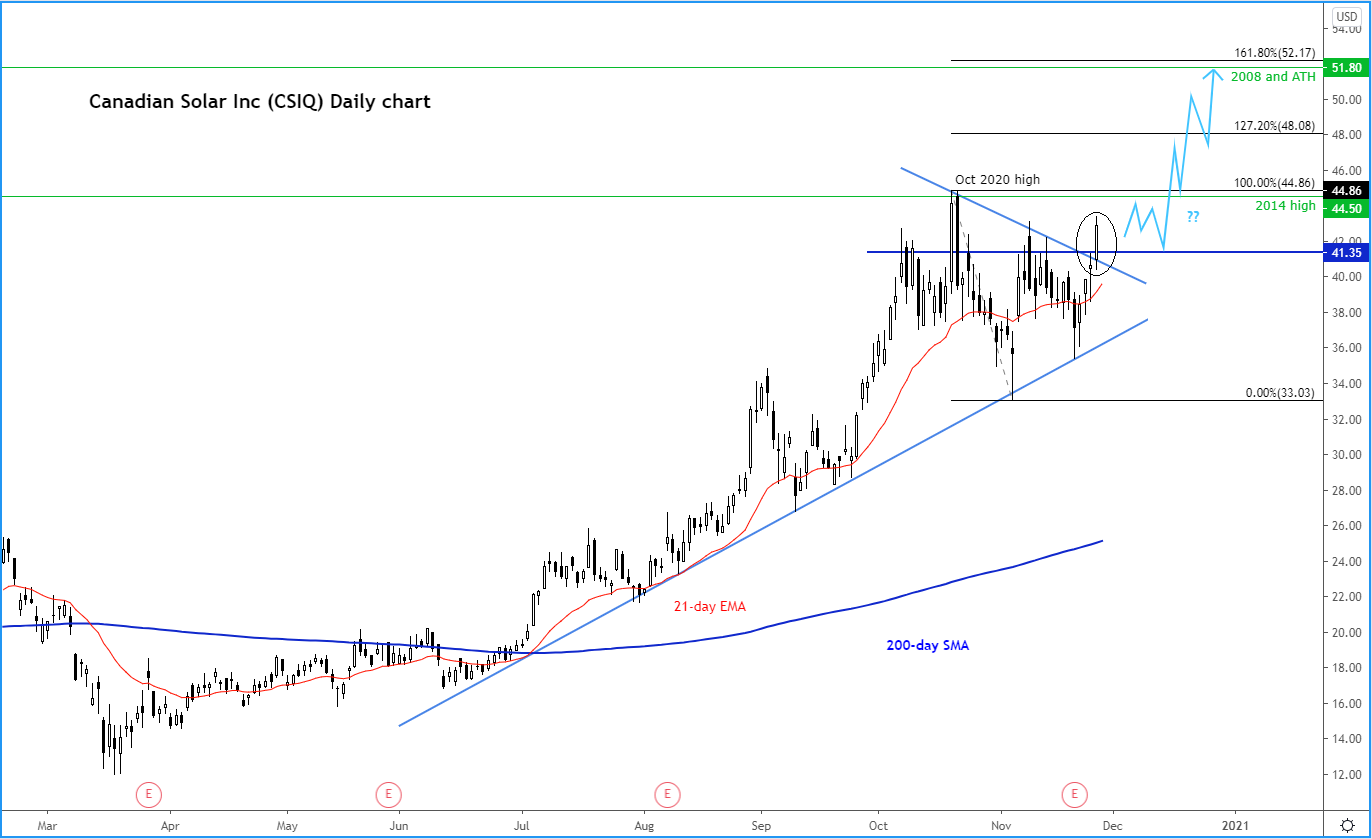
| But I wanted to highlight Canadian Solar Inc (CSIQ) in this article, which has also been printing bullish price action of late, and might be about to break further higher: |

|
| Figure 1. Daily chart for CSIQ. |
| Graphic provided by: TradingView. |
| |
| Shares in the company have recently been consolidating inside a triangle pattern near the recent highs. But as you can see, they have now broken out of the pattern to the upside, potentially paving the way for a run toward the 2008 record high of around $51.80, which also corresponds with the 161.8% Fibonacci extension of the small correction from the October 2020 peak. In fact, the first bullish target is the liquidity above that October 2020 high at $44.86, which as it happens comes in just above the 2014 high of $44.50. The 127.2% Fibonacci extension is an additional target, at $44.08. In terms of support, the breakout area at $41.35ish is the most important short-term level that needs to hold now. Below this, the bullish trend line comes in around $38-$39 area. But if the stock falls below the trend line then that would be a bearish development. |
Fawad Razaqzada is an experienced analyst and economist having been involved in the financial markets since 2010 working for leading global FX and CFD brokerages. Having graduated with a degree in economics and leveraging years of financial market experience, Fawad provides retail and professional traders worldwide with succinct fundamental & technical analysis. In addition, he also offers premium trade signals to subscribers, and trading education to help shorten the learning curves of developing traders. He has also been trading on his personal account for many years. Follow Fawad on twitter @Trader_F_R or visit his website at TradingCandles.com.
| Title: | Financial Market Analyst |
| Company: | TradingCandles.com |
| London, | |
| Website: | tradingcandles.com |
| E-mail address: | fawad.razaqzada@hotmail.co.uk |
Traders' Resource Links | |
| TradingCandles.com has not added any product or service information to TRADERS' RESOURCE. | |
Click here for more information about our publications!
PRINT THIS ARTICLE

Request Information From Our Sponsors
- StockCharts.com, Inc.
- Candle Patterns
- Candlestick Charting Explained
- Intermarket Technical Analysis
- John Murphy on Chart Analysis
- John Murphy's Chart Pattern Recognition
- John Murphy's Market Message
- MurphyExplainsMarketAnalysis-Intermarket Analysis
- MurphyExplainsMarketAnalysis-Visual Analysis
- StockCharts.com
- Technical Analysis of the Financial Markets
- The Visual Investor
- VectorVest, Inc.
- Executive Premier Workshop
- One-Day Options Course
- OptionsPro
- Retirement Income Workshop
- Sure-Fire Trading Systems (VectorVest, Inc.)
- Trading as a Business Workshop
- VectorVest 7 EOD
- VectorVest 7 RealTime/IntraDay
- VectorVest AutoTester
- VectorVest Educational Services
- VectorVest OnLine
- VectorVest Options Analyzer
- VectorVest ProGraphics v6.0
- VectorVest ProTrader 7
- VectorVest RealTime Derby Tool
- VectorVest Simulator
- VectorVest Variator
- VectorVest Watchdog
