HOT TOPICS LIST
- MACD
- Fibonacci
- RSI
- Gann
- ADXR
- Stochastics
- Volume
- Triangles
- Futures
- Cycles
- Volatility
- ZIGZAG
- MESA
- Retracement
- Aroon
INDICATORS LIST
LIST OF TOPICS
PRINT THIS ARTICLE
by Fawad Razaqzada
Monday, November 9, was another big risk-on day for financial markets. For the first time since the pandemic, there was hope and light at the end of the tunnel that coronavirus restrictions that have been imposed across the world could soon be a thing of the past.
Position: N/A
Fawad Razaqzada
Fawad Razaqzada is an experienced analyst and economist having been involved in the financial markets since 2010 working for leading global FX and CFD brokerages. Having graduated with a degree in economics and leveraging years of financial market experience, Fawad provides retail and professional traders worldwide with succinct fundamental & technical analysis. In addition, he also offers premium trade signals to subscribers, and trading education to help shorten the learning curves of developing traders. He has also been trading on his personal account for many years. Follow Fawad on twitter @Trader_F_R or visit his website at TradingCandles.com.
PRINT THIS ARTICLE
Crude Oil Takes Shot In The Arm
11/19/20 02:47:47 PMby Fawad Razaqzada
Monday, November 9, was another big risk-on day for financial markets. For the first time since the pandemic, there was hope and light at the end of the tunnel that coronavirus restrictions that have been imposed across the world could soon be a thing of the past.
Position: N/A
| So, are oil prices about to come back in a meaningful way? Sentiment was already boosted by Joe Biden's victory in the U.S. presidential election race, but risk assets surged sharply higher on the back of news that Pfizer-BioNTech has developed the first effective Covid-19 vaccine. According to preliminary analysis, the vaccine prevented more than 90% of the tens of thousands of volunteers from getting the disease. This was the first vaccine in final stages of testing to show results, and if the data holds up, it will pave the way for emergency-use authorization across the world — even if large-scale production of the shot will probably take quite some time. With more vaccines in phase 3 trials, expect to hear further good news in the weeks to come. |
| While questions over logistical challenges remain, investors made their minds up Monday as they bought stocks that had been badly hurt by the pandemic, especially in the hospitality and travel sectors, while also bidding up crude oil on expectations over firmer demand for the commodity. The news caused haven assets such as benchmark government bond prices, the Japanese yen, Swiss franc and gold to tank. |
| It will be interesting to see how crude oil will perform going forward as investors now start to look forward to more normal times ahead. Prices could recover sharply on hopes over a stronger recovery in demand once lockdowns are lifted. At the same time, ongoing OPEC+ restrictions could limit the supply growth, potentially resulting in higher prices. So, when it comes to trading crude oil, I would be more inclined to look for setups on the long than short side. |

|
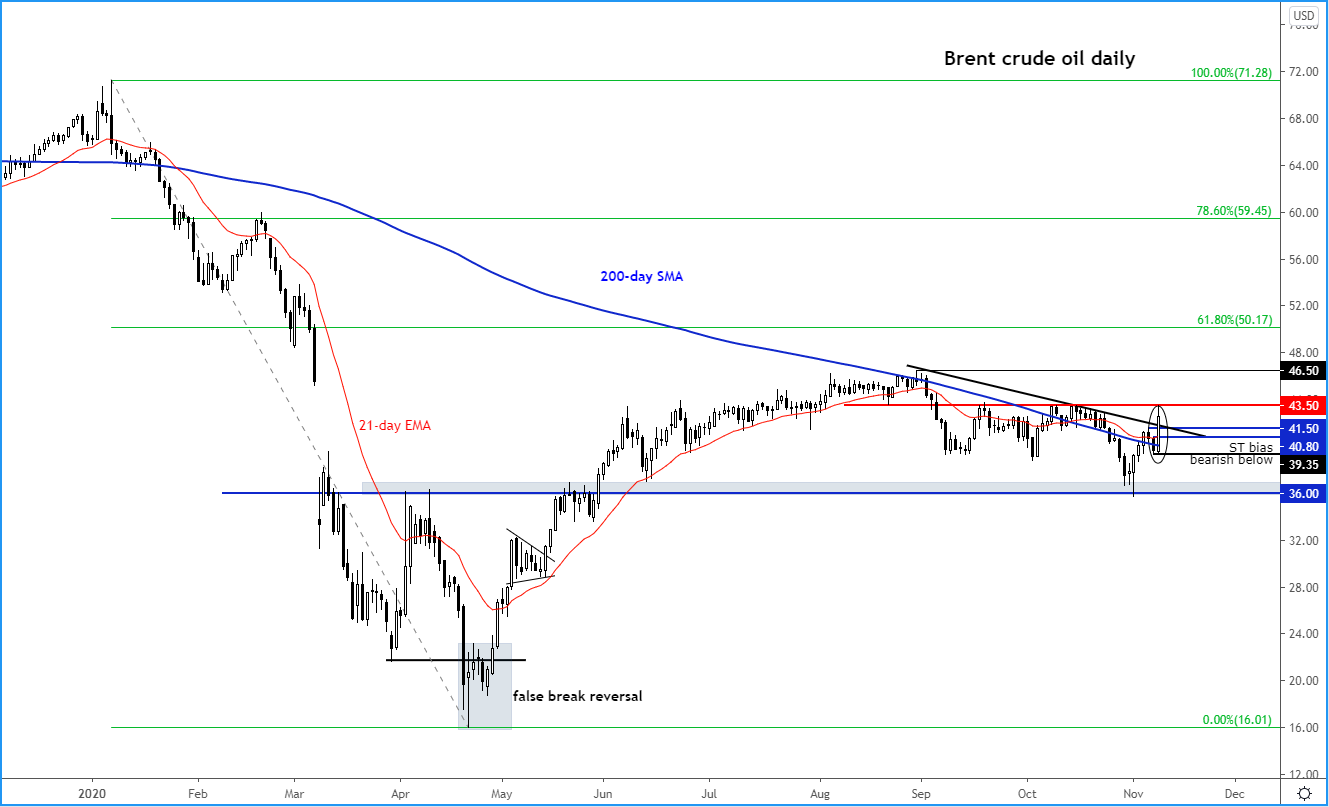
| Figure 1. Brent Crude Oil Daily Chart. |
| Graphic provided by: TradingView. |
| |
| Indeed, Brent crude oil has broken above its bearish trend line that had been in place since the of the summer. Thanks to Monday's big rally, prices have now recovered above the 21-day exponential and 200-day simple moving averages. Thus objectively, the path of least resistance is to the upside both in the short- and longer-term horizons. From here, resistance at $43.50 looks in danger of breaking, as prices potentially move towards - and potentially beyond - the summer highs of around $46.50 next. The Fibonacci retracement levels shown on the chart are among some of the additional bullish objectives. |
| The above technical bullish analysis remains valid unless prices create a lower low or some other sort of a reversal. For example, if prices go below the recent low at $39.35, it would point to a massive bull trap. |
Fawad Razaqzada is an experienced analyst and economist having been involved in the financial markets since 2010 working for leading global FX and CFD brokerages. Having graduated with a degree in economics and leveraging years of financial market experience, Fawad provides retail and professional traders worldwide with succinct fundamental & technical analysis. In addition, he also offers premium trade signals to subscribers, and trading education to help shorten the learning curves of developing traders. He has also been trading on his personal account for many years. Follow Fawad on twitter @Trader_F_R or visit his website at TradingCandles.com.
| Title: | Financial Market Analyst |
| Company: | TradingCandles.com |
| London, | |
| Website: | tradingcandles.com |
| E-mail address: | fawad.razaqzada@hotmail.co.uk |
Traders' Resource Links | |
| TradingCandles.com has not added any product or service information to TRADERS' RESOURCE. | |
Click here for more information about our publications!
PRINT THIS ARTICLE

Request Information From Our Sponsors
- VectorVest, Inc.
- Executive Premier Workshop
- One-Day Options Course
- OptionsPro
- Retirement Income Workshop
- Sure-Fire Trading Systems (VectorVest, Inc.)
- Trading as a Business Workshop
- VectorVest 7 EOD
- VectorVest 7 RealTime/IntraDay
- VectorVest AutoTester
- VectorVest Educational Services
- VectorVest OnLine
- VectorVest Options Analyzer
- VectorVest ProGraphics v6.0
- VectorVest ProTrader 7
- VectorVest RealTime Derby Tool
- VectorVest Simulator
- VectorVest Variator
- VectorVest Watchdog
- StockCharts.com, Inc.
- Candle Patterns
- Candlestick Charting Explained
- Intermarket Technical Analysis
- John Murphy on Chart Analysis
- John Murphy's Chart Pattern Recognition
- John Murphy's Market Message
- MurphyExplainsMarketAnalysis-Intermarket Analysis
- MurphyExplainsMarketAnalysis-Visual Analysis
- StockCharts.com
- Technical Analysis of the Financial Markets
- The Visual Investor
