
HOT TOPICS LIST
- MACD
- Fibonacci
- RSI
- Gann
- ADXR
- Stochastics
- Volume
- Triangles
- Futures
- Cycles
- Volatility
- ZIGZAG
- MESA
- Retracement
- Aroon
INDICATORS LIST
LIST OF TOPICS
PRINT THIS ARTICLE
by Matt Blackman
The sector has been very strong. But how long this will continue is anyone's guess.
Position: N/A
Matt Blackman
Matt Blackman is a full-time technical and financial writer and trader. He produces corporate and financial newsletters, and assists clients in getting published in the mainstream media. Matt has earned the Chartered Market Technician (CMT) designation. Follow Matt on Twitter at www.twitter.com/RatioTrade
PRINT THIS ARTICLE
Solar Stocks Shining.... Again!
10/29/20 02:51:00 PMby Matt Blackman
The sector has been very strong. But how long this will continue is anyone's guess.
Position: N/A
| The Covid-19 pandemic has strongly influenced stocks — some have been punished, while others, including clean tech and solar, have performed admirably. So what's been driving them higher? China's commitment to become carbon neutral by 2060 is a big driver. Speaking via video link to the UN General Assembly September 22, China's President XI Jinping called for a "green revolution" and pledged to scale up his nation's commitments under the 2015 Paris Climate Accord. His nation is already leading the world in solar and wind installations and looks set to continue leading the world in clean energy production. This is significant for three reasons. First, China is home to and manufactures the majority of solar panels in the world. Second, this is the first time the country has issued a concrete plan to become carbon neutral. And last but not least, China is the largest user of coal, accounting for nearly 60% of total energy consumption and 66% of its electricity. Not surprisingly, China is also the biggest global greenhouse gas emitter, so highly motivated to reduce emissions. |
|
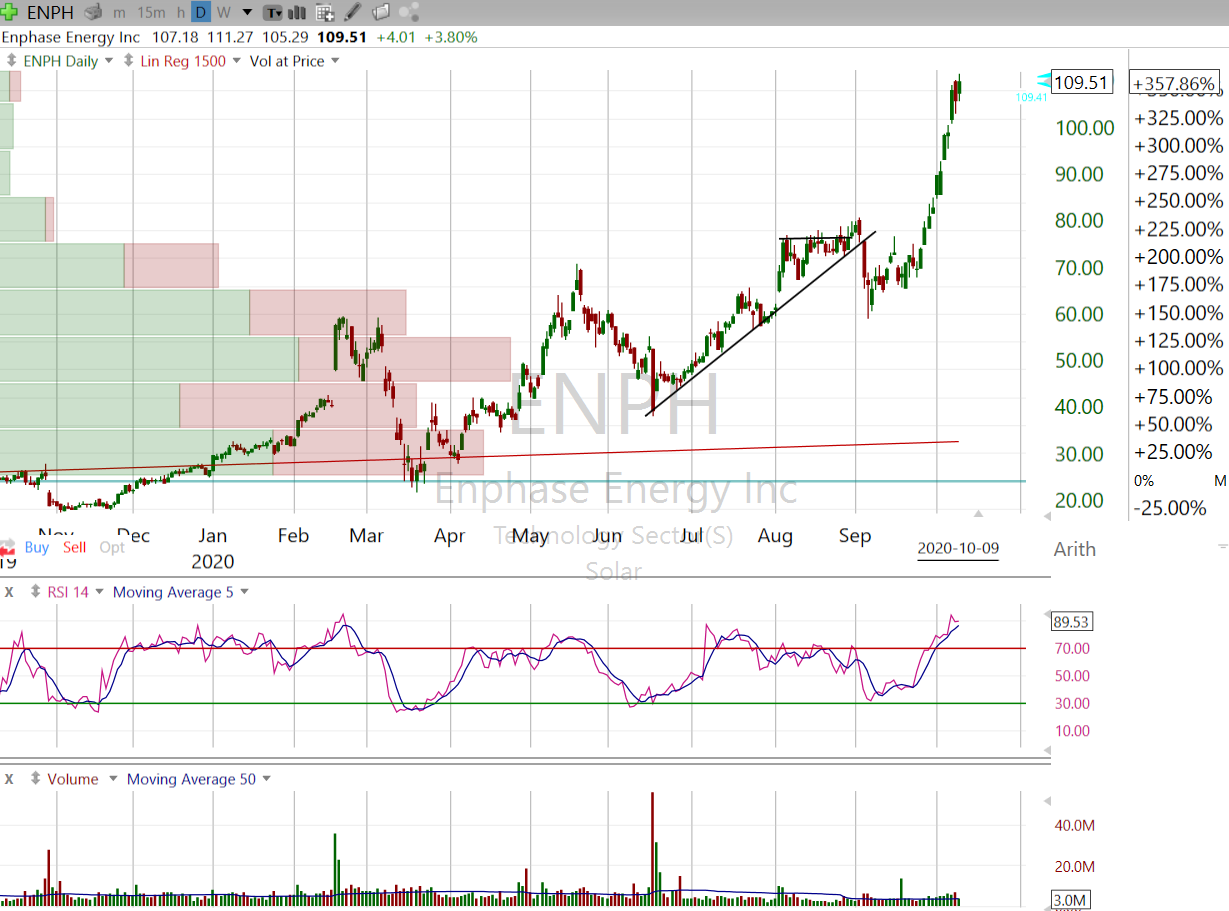
| Figure 1. Daily chart of Enphase Energy Inc. (ENPH) showing the big jump between mid-September and early October together with its long-term linear regression line (red). |
| Graphic provided by: Freestockcharts.com. |
| |
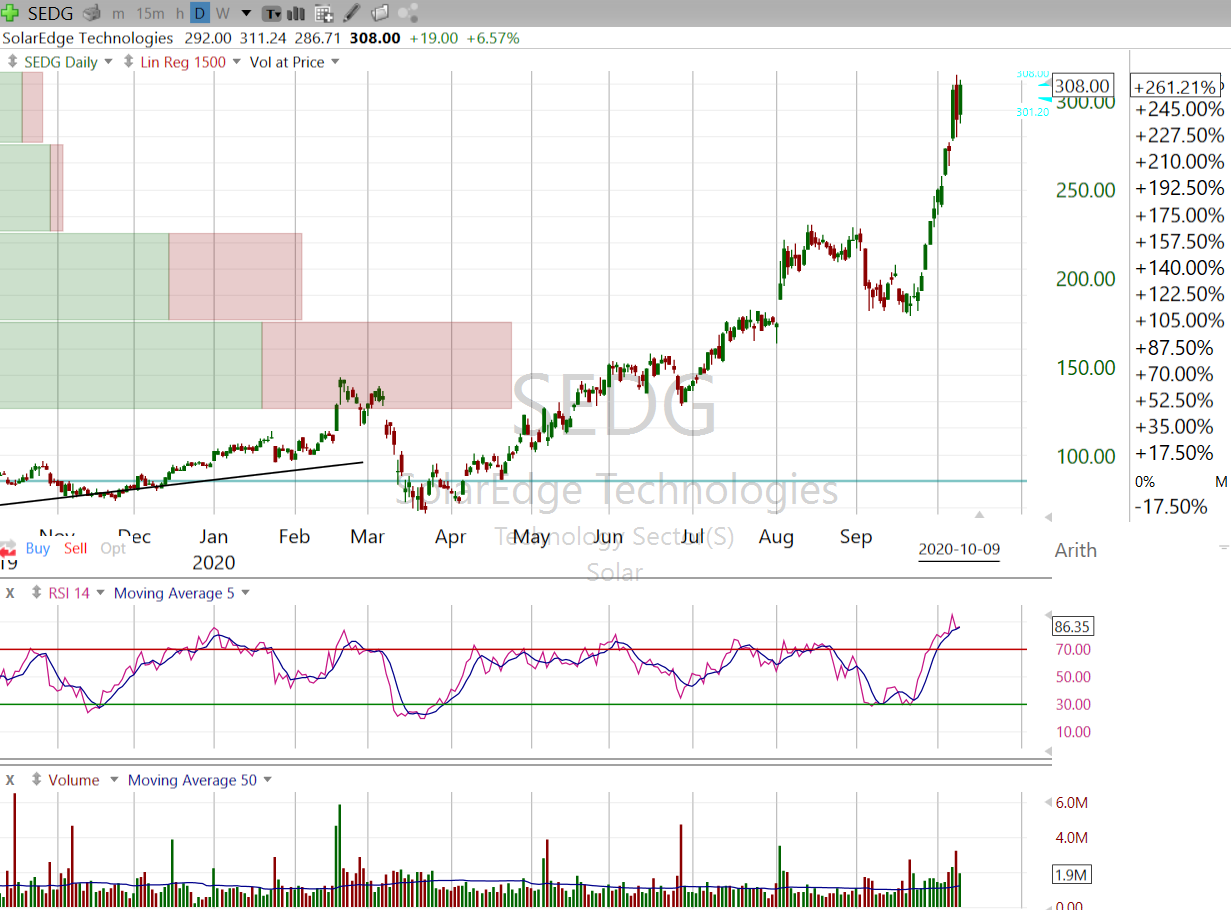
| Here we see the top performing solar stocks into October. The monthly winner — solar component maker Enphase Energy Inc. — led the pack of solar companies over the last month gaining an impressive 62% and has jumped more than 340% over the last year. Earnings per share (EPS) are up an impressive 1437% in the last year! From a seasonality perspective, ENPH has historically performed best between early January and the third week in August over its seven year history according to EquityClock.com. Next, is Solar Edge Technologies, a provider of solar inverters and other photovoltaic components, which has gained more than 260% in the last year and is up more than 60% in the last month. The company has seen its EPS rise 47% in the last year and boasts a five-year earnings growth rate of 60.3%. Like ENPH, SEDG has been seasonally strongest from early in the year (mid-February) to mid-December but it has only been publicly trading since 2015 limiting the trading value of any seasonal trends. |
|
| Figure 2. Daily chart of SolarEdge Technologies over the last year showing its early fall 2020 breakout. |
| Graphic provided by: StockCharts.com. |
| |
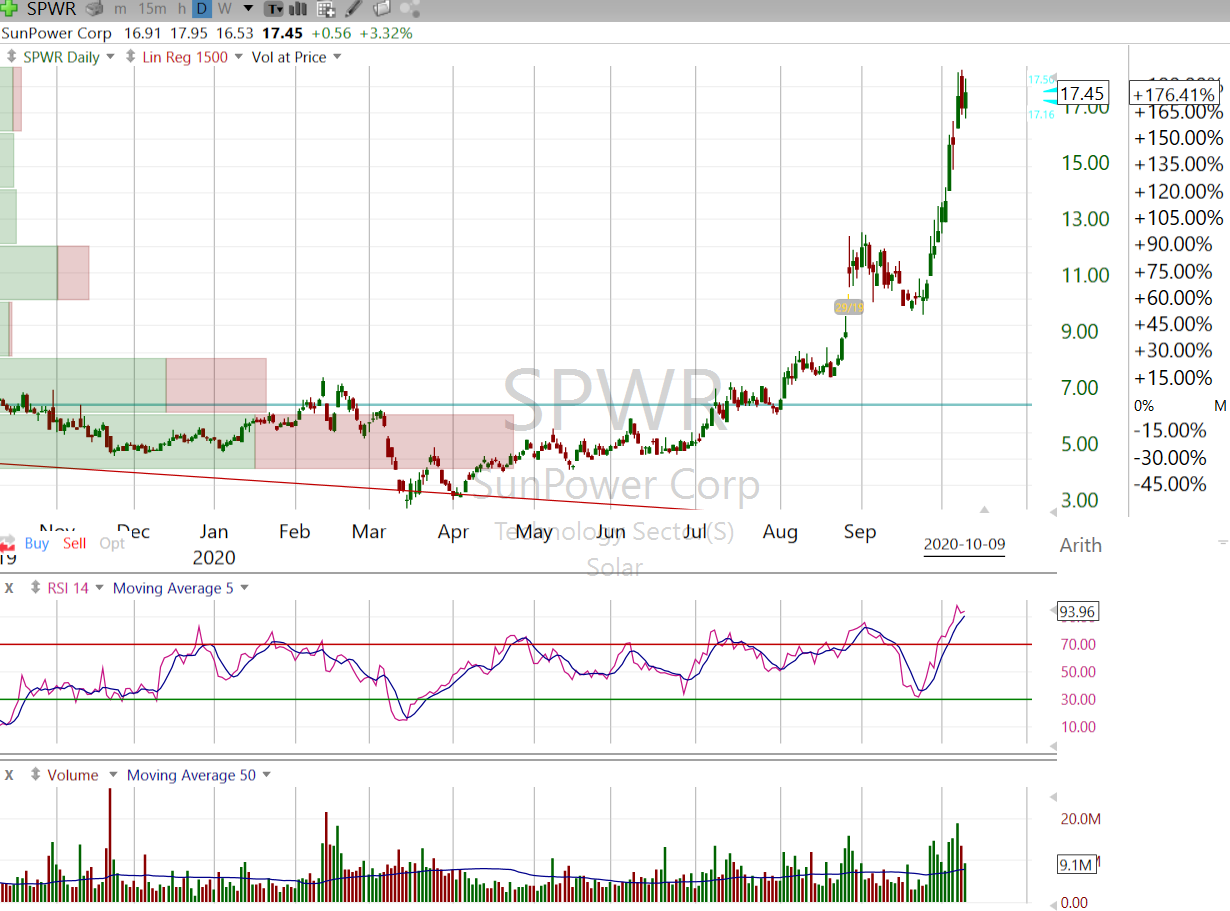
| Next, SunPower Corp., a solar systems provider, is up 56% in the last month and 173% on the year. Earnings per share have risen 101% in the last year. SunPower has traditionally performed best from early February through July over its 14-year trading history. |
|
| Figure 3. Daily chart of SunPower Corp showing its performance over the last year and downward sloping long-term linear regression line. |
| Graphic provided by: Freestockcharts.com. |
| |
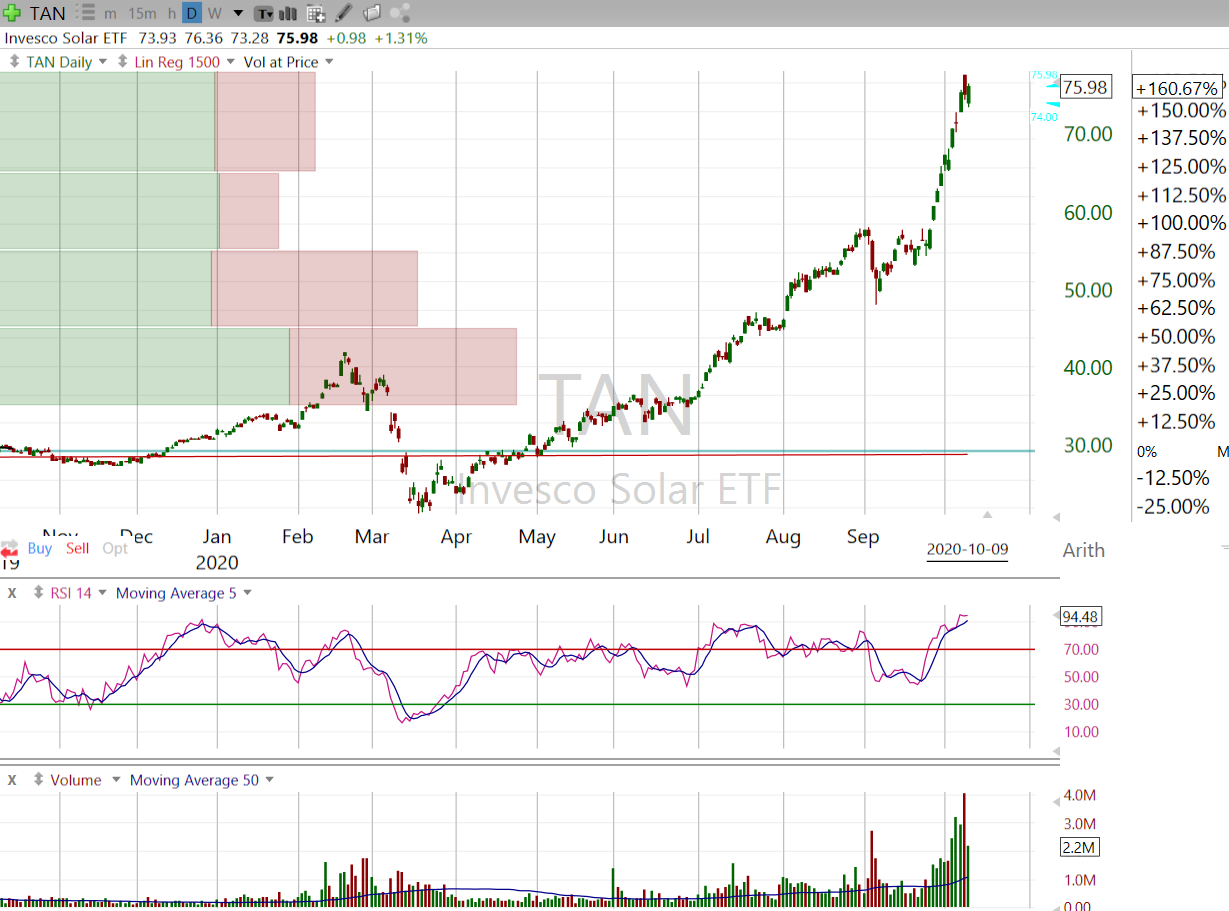
| Finally, a stock that offers solar company diversification in the space is the Invesco Solar ETF trading symbol TAN consisting of a basket of more than 20 global solar companies, including the three companies above. TAN has gained more than 40% in the last month and is up an impressive 158% in the last year, reflecting the overall strength of the sector. But as we see in the last chart showing TAN seasonality, it has been much more volatile over its 11 year history and shows no consistent and sustained 'best' time to buy. |
|
| Figure 4. Daily chart of ETF TAN showing its performance over the last year together with the flat long-term linear regression line (red). |
| Graphic provided by: Freestockcharts.com. |
| |
Solar stocks have been clearly strong leaders in the 4th industrial clean tech revolution and costs continue to fall. In many areas of the world it has supplanted fossil fuels, including coal, as the most cost effective utility electrical generation source and this trend is expected to continue. 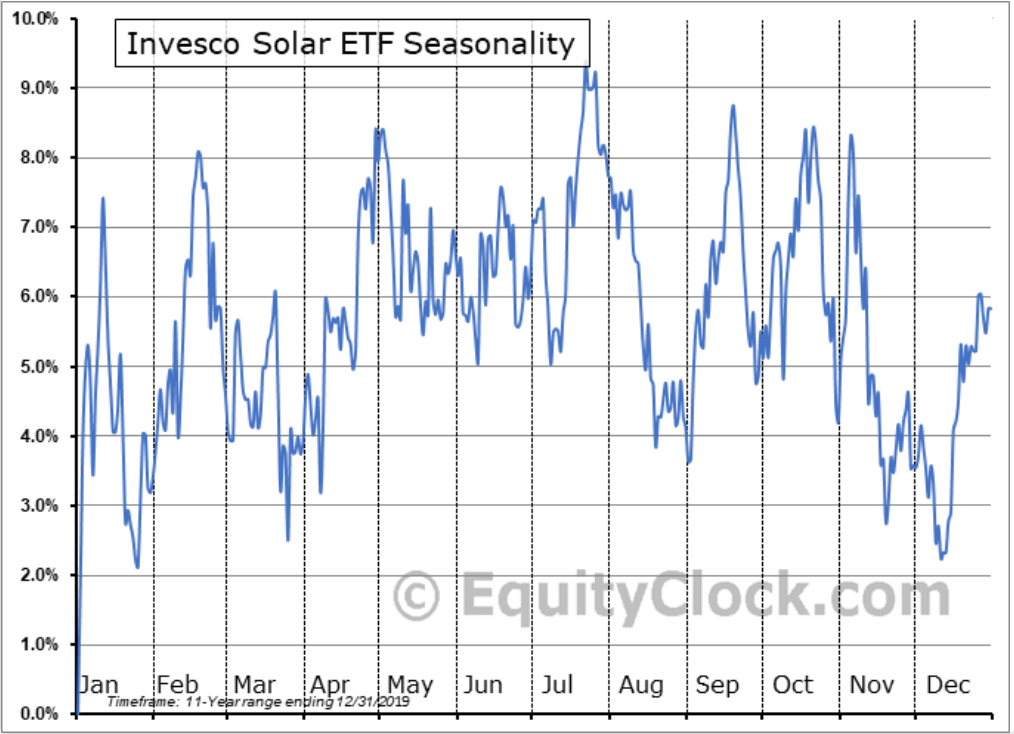 Figure 5. Chart showing TAN seasonality. Chart courtesy EquityClock.com The challenge is that solar companies have been subject to wild swings depending on government subsidies and utility regulations that have both helped and hindered solar adoption from a regulatory standpoint. I would also expect to see this space get increasingly competitive as new companies join the industry in the coming years. Can China, the world's biggest coal consumer, become carbon neutral by 2060? Enphase Energy Solar Edge Technologies SunPower Corp Invesco Solar ETF Components Stock Seasonality charts |
Matt Blackman is a full-time technical and financial writer and trader. He produces corporate and financial newsletters, and assists clients in getting published in the mainstream media. Matt has earned the Chartered Market Technician (CMT) designation. Follow Matt on Twitter at www.twitter.com/RatioTrade
| Title: | Author |
| Company: | TradeSystemGuru |
| Address: | Box 2589 |
| Garibaldi Highlands, BC V0N1T0 | |
| Phone # for sales: | 6048989069 |
| E-mail address: | indextradermb@gmail.com |
Traders' Resource Links | |
| TradeSystemGuru has not added any product or service information to TRADERS' RESOURCE. | |
Click here for more information about our publications!
PRINT THIS ARTICLE

Request Information From Our Sponsors
- StockCharts.com, Inc.
- Candle Patterns
- Candlestick Charting Explained
- Intermarket Technical Analysis
- John Murphy on Chart Analysis
- John Murphy's Chart Pattern Recognition
- John Murphy's Market Message
- MurphyExplainsMarketAnalysis-Intermarket Analysis
- MurphyExplainsMarketAnalysis-Visual Analysis
- StockCharts.com
- Technical Analysis of the Financial Markets
- The Visual Investor
- VectorVest, Inc.
- Executive Premier Workshop
- One-Day Options Course
- OptionsPro
- Retirement Income Workshop
- Sure-Fire Trading Systems (VectorVest, Inc.)
- Trading as a Business Workshop
- VectorVest 7 EOD
- VectorVest 7 RealTime/IntraDay
- VectorVest AutoTester
- VectorVest Educational Services
- VectorVest OnLine
- VectorVest Options Analyzer
- VectorVest ProGraphics v6.0
- VectorVest ProTrader 7
- VectorVest RealTime Derby Tool
- VectorVest Simulator
- VectorVest Variator
- VectorVest Watchdog
