

HOT TOPICS LIST
- MACD
- Fibonacci
- RSI
- Gann
- ADXR
- Stochastics
- Volume
- Triangles
- Futures
- Cycles
- Volatility
- ZIGZAG
- MESA
- Retracement
- Aroon
INDICATORS LIST
LIST OF TOPICS
PRINT THIS ARTICLE
by Mark Rivest
See how markets react to tragic surprise news.
Position: N/A
Mark Rivest
Independent investment advisor, trader and writer. He has written articles for Technical Analysis of Stocks & Commodities, Traders.com Advantage,Futuresmag.com and, Finance Magnates. Author of website Four Dimension Trading.
PRINT THIS ARTICLE
MARKET TIMING
The Effects Of Unexpected Events
10/15/20 04:30:21 PMby Mark Rivest
See how markets react to tragic surprise news.
Position: N/A
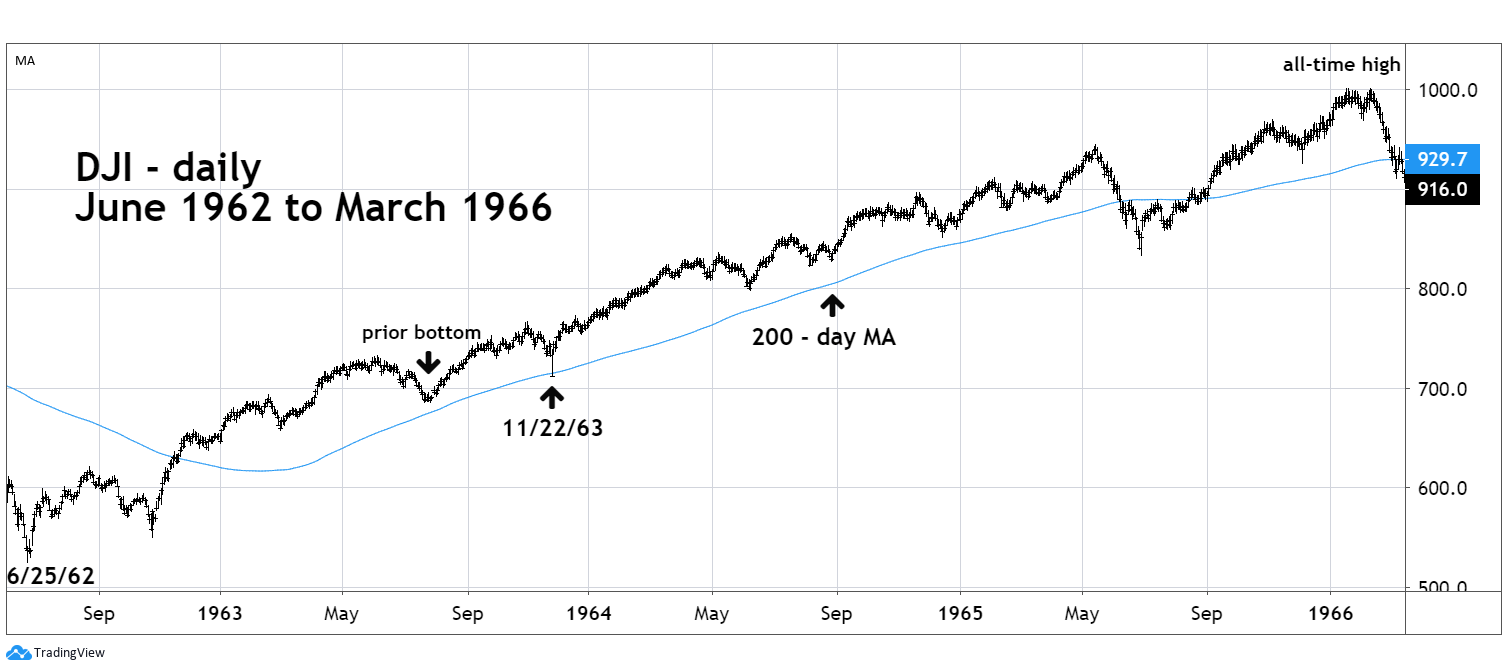
| Thoughts and prayers go out to US President Donald Trump and First Lady Melania Trump for a rapid recovery from the Coronavirus. This shocking event triggered a sharp selloff in the US stock market. A study of prior unexpected adverse news reveals how the stock market reacts. November 1963 The assassination of US President John F. Kennedy in November 1963 was one of the most tragic events of the twentieth century, triggering shock and grief worldwide. Please see the daily Dow Jones Industrial Average (DJI) chart illustrated in Figure 1. From December 1961 to June 1962 the DJI lost 28% of its value in a steep bear market. After the bear market bottom June 25, 1962, the DJI then rallied into late August 1962 followed by a typical seasonal decline into October 1962. This decline held above the June bottom and the subsequent rally moved above the August top and broke above the 200-day Moving Average (MA) line. Following these bullish signals, the DJIA continued rising with a series of rising peaks and bottoms — the signature of a bull move. The decline that began in late October 1963 may have caused bulls concern as the drop continued into November which is seasonally the most bullish month of the year. When tragedy struck on November 22 the DJI went into a micro-crash that held above the important prior bottom made in July 1963. The 200-day MA provided support, and when trading resumed on November 26 the entire micro-crash was erased. The DJI continued to rise until the bull trend terminated in February 1966 at important round number resistance DJI 1000. |
|
| Figure 1. DJI went into a micro-crash that held above the important prior bottom made in July 1963. |
| Graphic provided by: TradingView. |
| |
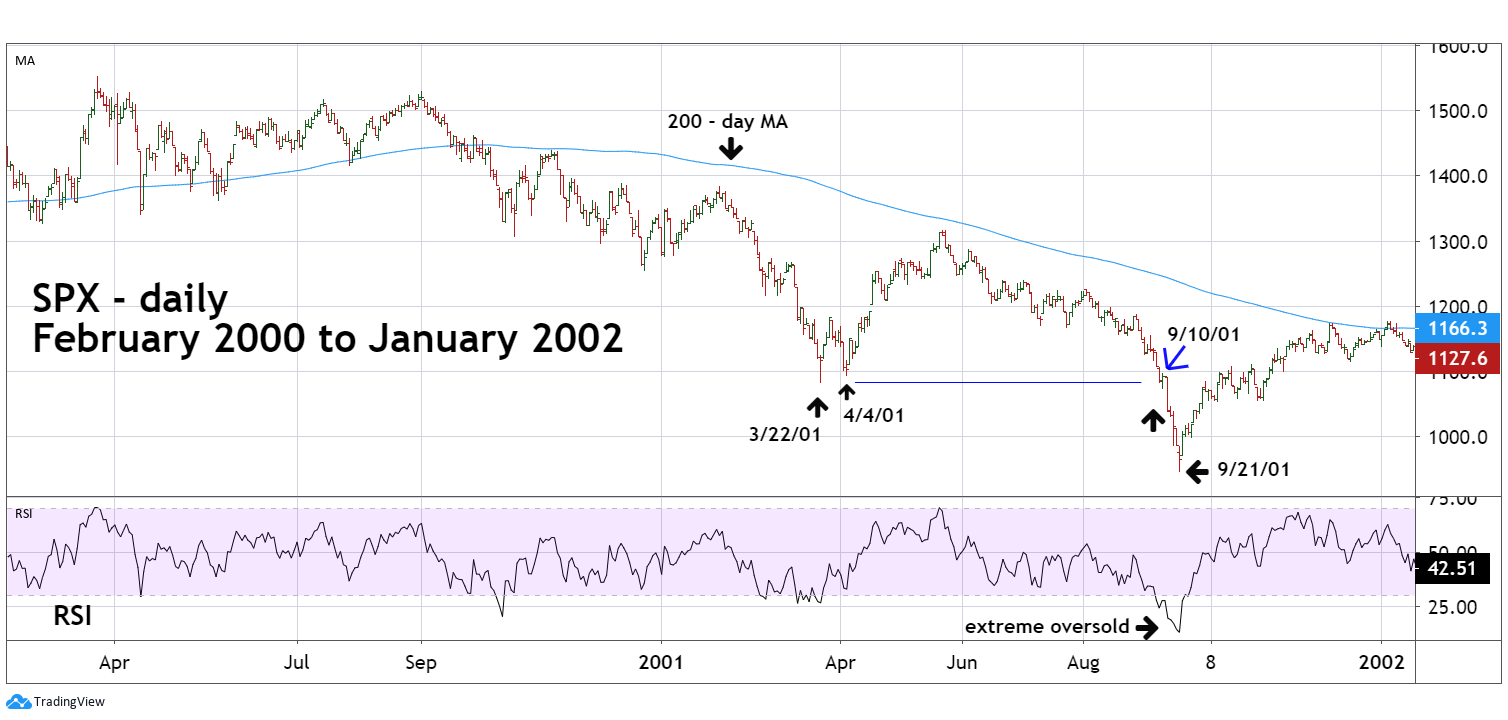
| September 2001 The devastating terrorist attacks of 9/11/2001 caused fear and anguish in the US and beyond. The condition of the US stock market in September 2001 was completely different than November 1963. Please see the daily S&P 500 (SPX) chart illustrated in Figure 2. The SPX secular bull market peaked in March 2000 and then proceeded to make a series of lower lows and lower highs — the signature of a bear move. After October 2000, the SPX held below the 200-day MA. By September 2001 it was clear the primary SPX trend was down, the action in early September confirmed the trend. For stocks, RSI usually gives confirmations of a bottom when it goes below 20%, an extreme low value. Or if there's a bullish RSI divergence when the SPX is below a prior bottom. On September 7, 2001, the SPX close was 1085.80 with an RSI 24% vs. the SPX April 4, 2001 closing of 1103.30 where the RSI was 32%. The September RSI reading was not in the extreme oversold zone, nor was there a bullish divergence. A confirmed low. On September 10, 2001, the SPX moved below the bottom made on March 22, 2001 — a new bear market low confirming the downtrend. The 9/11 attacks accelerated the existing downtrend. If the attacks had not occurred the SPX probably could have continued down at a slower pace and maybe reach a short-term bottom in October 2001 rather than September 21, 2001. After the September 2001 bottom the SPX rallied into March 2002 before resuming the bear trend that ultimately ended in October 2002 — 18% below the September 2001 low. |
|
| Figure 2. The 9/11 attacks accelerated the existing downtrend. |
| Graphic provided by: TradingView. |
| |
| Primary Trend The main goal of any technical analyst is knowing a market's primary trend. With this knowledge, unexpected events will probably not interrupt the bull move. If important support levels are broken, something else may be going on. In confirmed downtrends adverse surprises are like throwing gasoline on a fire. There are many different factors that determine the main trend of any market. Major trend changes come when a market is extremely overvalued/undervalued relative to the fundamentals. Technical Analysis provides the best tools to help discover potential trend changes. Further Reading: Neill B. Humphrey (1985) "The Art of Contrary Thinking" The Caxton Printers. |
Independent investment advisor, trader and writer. He has written articles for Technical Analysis of Stocks & Commodities, Traders.com Advantage,Futuresmag.com and, Finance Magnates. Author of website Four Dimension Trading.
| Website: | www.fourdimensiontrading.com |
| E-mail address: | markrivest@gmail.com |
Click here for more information about our publications!
PRINT THIS ARTICLE

Request Information From Our Sponsors
- StockCharts.com, Inc.
- Candle Patterns
- Candlestick Charting Explained
- Intermarket Technical Analysis
- John Murphy on Chart Analysis
- John Murphy's Chart Pattern Recognition
- John Murphy's Market Message
- MurphyExplainsMarketAnalysis-Intermarket Analysis
- MurphyExplainsMarketAnalysis-Visual Analysis
- StockCharts.com
- Technical Analysis of the Financial Markets
- The Visual Investor
- VectorVest, Inc.
- Executive Premier Workshop
- One-Day Options Course
- OptionsPro
- Retirement Income Workshop
- Sure-Fire Trading Systems (VectorVest, Inc.)
- Trading as a Business Workshop
- VectorVest 7 EOD
- VectorVest 7 RealTime/IntraDay
- VectorVest AutoTester
- VectorVest Educational Services
- VectorVest OnLine
- VectorVest Options Analyzer
- VectorVest ProGraphics v6.0
- VectorVest ProTrader 7
- VectorVest RealTime Derby Tool
- VectorVest Simulator
- VectorVest Variator
- VectorVest Watchdog