

HOT TOPICS LIST
- MACD
- Fibonacci
- RSI
- Gann
- ADXR
- Stochastics
- Volume
- Triangles
- Futures
- Cycles
- Volatility
- ZIGZAG
- MESA
- Retracement
- Aroon
INDICATORS LIST
LIST OF TOPICS
PRINT THIS ARTICLE
by Fawad Razaqzada
I wrote this article following the close of play on September 24, after noticing a potentially bullish signal on the S&P 500 as well as some other key global indices, indicating that the recent sell-off may be about to come to an end.
Position: N/A
Fawad Razaqzada
Fawad Razaqzada is an experienced analyst and economist having been involved in the financial markets since 2010 working for leading global FX and CFD brokerages. Having graduated with a degree in economics and leveraging years of financial market experience, Fawad provides retail and professional traders worldwide with succinct fundamental & technical analysis. In addition, he also offers premium trade signals to subscribers, and trading education to help shorten the learning curves of developing traders. He has also been trading on his personal account for many years. Follow Fawad on twitter @Trader_F_R or visit his website at TradingCandles.com.
PRINT THIS ARTICLE
S&P Tests Key Level As Investors Weigh Conflicting Macro Factors
09/30/20 04:54:14 PMby Fawad Razaqzada
I wrote this article following the close of play on September 24, after noticing a potentially bullish signal on the S&P 500 as well as some other key global indices, indicating that the recent sell-off may be about to come to an end.
Position: N/A
| Stocks have fallen for four consecutive weeks, with the S&P 500 pulling back precisely 10.55% from its record high to its lowest point on Thursday, before reducing that to 9.52% at the close. Sentiment has been hurt by various macro factors, as well as profit-taking from record highs amid ongoing valuation concerns. Among investor concerns has been the alarming rise in virus cases across Western Europe and other parts of the world. This has revived growth concerns, just as the global economy was beginning to recover from the pandemic. In the US, there is also growing uncertainty over whether there will be more fiscal stimulus. Furthermore, investors appear not so keen on taking too much risk given the recent slowdown in stimulus-driven economic activity and ahead of the presidential election, with opinion polls being very tight with just 40 days to go. |
| Still, the selling has not been anything like in March. It appears as though investors are not too concerned about the resurgent virus cases in Europe and elsewhere. For one thing, this is because death rates have remained very low in Europe this time around, suggesting a stronger immunity has been developed while more tests are being carried out. For another, we are potentially a lot closer to finding an effective vaccine than back in March. So, investors are not panicking like they did earlier in the year when they dumped risk assets aggressively. What's more, the Fed and other major central banks — who have already loosened their belts and expanded their stimulus programs aggressively in response to the pandemic — keep reminding investors that more stimulus may be provided, if needed. |
| With monetary stimulus taps wide open, and more fiscal stimulus potentially on the way, the 4-week sell-off may be about to end soon. It is worth noting that some investors who were presumably hoping for a pullback have now got a 10% correction from the record high, which makes it more likely than not that we could see a rebound soon. |
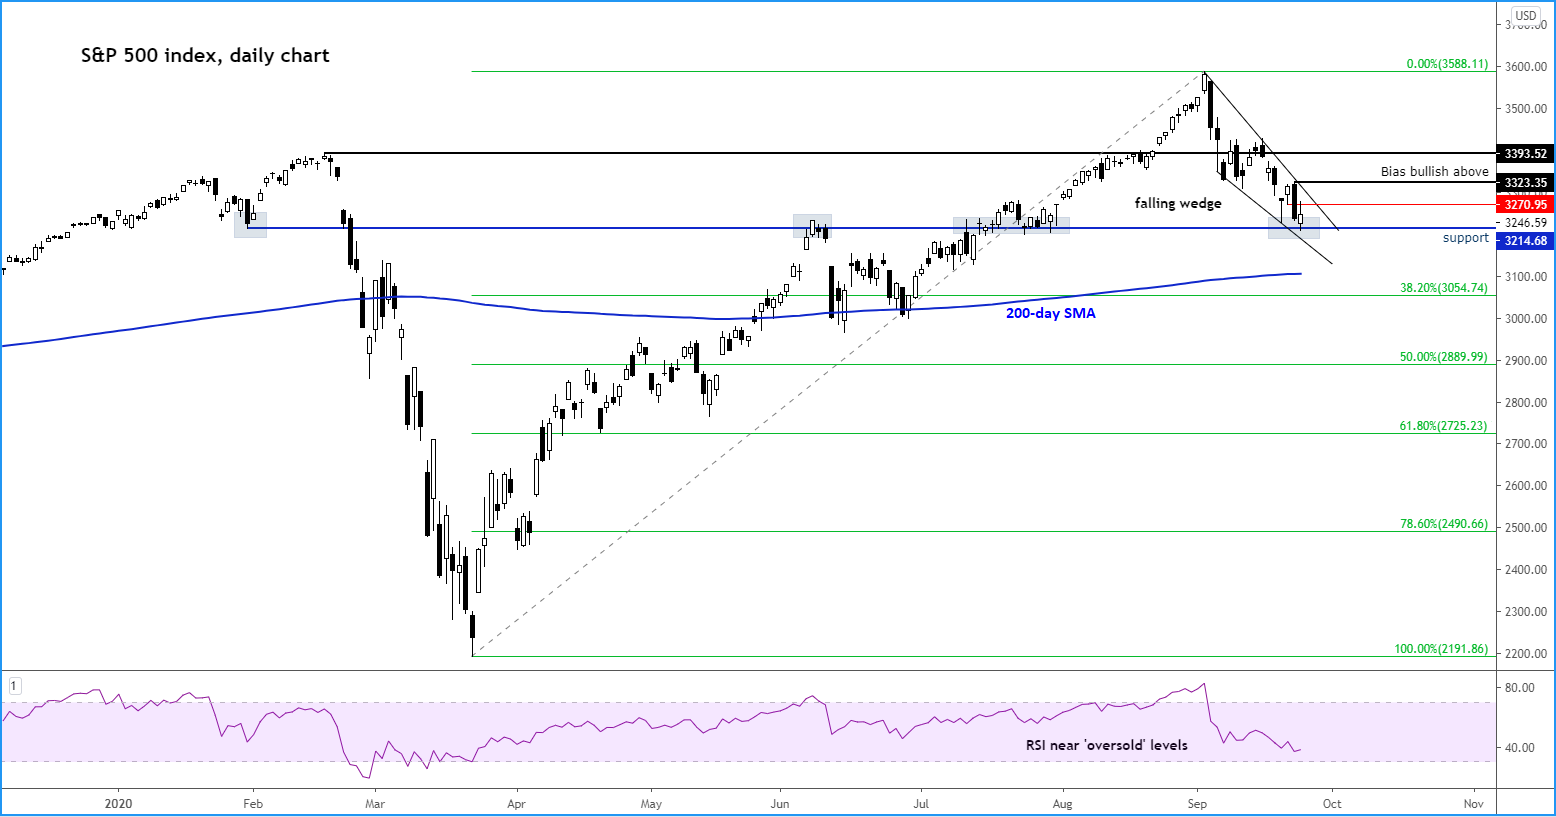
| So, taking everything into consideration, I would not be surprised if the markets continued higher soon. For confirmation, I would like to see the S&P stage a breakout from THIS falling wedge pattern: |
|
| Figure 1. S&P 500 Daily Chart. |
| Graphic provided by: TradingView. |
| |
| Despite its name, a falling wedge is a bullish continuation pattern. A break and hold above the resistance trend would be deemed a bullish development by technical analysis enthusiasts. While we await that potential breakout, it is worth pointing out the fact the index has now reached a pivotal level as well. The 3214/3215 area was both support and resistance in the past, and on Thursday it once again triggered a reaction as the Spoos started to turn higher from around this level to eventually end up in the black after being red earlier in the day. The reaction was nice, but it now needs to break out of this falling wedge — and soon. Otherwise, there is a risk we could see further falls in the near-term. |
Fawad Razaqzada is an experienced analyst and economist having been involved in the financial markets since 2010 working for leading global FX and CFD brokerages. Having graduated with a degree in economics and leveraging years of financial market experience, Fawad provides retail and professional traders worldwide with succinct fundamental & technical analysis. In addition, he also offers premium trade signals to subscribers, and trading education to help shorten the learning curves of developing traders. He has also been trading on his personal account for many years. Follow Fawad on twitter @Trader_F_R or visit his website at TradingCandles.com.
| Title: | Financial Market Analyst |
| Company: | TradingCandles.com |
| London, | |
| Website: | tradingcandles.com |
| E-mail address: | fawad.razaqzada@hotmail.co.uk |
Traders' Resource Links | |
| TradingCandles.com has not added any product or service information to TRADERS' RESOURCE. | |
Click here for more information about our publications!
PRINT THIS ARTICLE

Request Information From Our Sponsors
- StockCharts.com, Inc.
- Candle Patterns
- Candlestick Charting Explained
- Intermarket Technical Analysis
- John Murphy on Chart Analysis
- John Murphy's Chart Pattern Recognition
- John Murphy's Market Message
- MurphyExplainsMarketAnalysis-Intermarket Analysis
- MurphyExplainsMarketAnalysis-Visual Analysis
- StockCharts.com
- Technical Analysis of the Financial Markets
- The Visual Investor
- VectorVest, Inc.
- Executive Premier Workshop
- One-Day Options Course
- OptionsPro
- Retirement Income Workshop
- Sure-Fire Trading Systems (VectorVest, Inc.)
- Trading as a Business Workshop
- VectorVest 7 EOD
- VectorVest 7 RealTime/IntraDay
- VectorVest AutoTester
- VectorVest Educational Services
- VectorVest OnLine
- VectorVest Options Analyzer
- VectorVest ProGraphics v6.0
- VectorVest ProTrader 7
- VectorVest RealTime Derby Tool
- VectorVest Simulator
- VectorVest Variator
- VectorVest Watchdog