

HOT TOPICS LIST
- MACD
- Fibonacci
- RSI
- Gann
- ADXR
- Stochastics
- Volume
- Triangles
- Futures
- Cycles
- Volatility
- ZIGZAG
- MESA
- Retracement
- Aroon
INDICATORS LIST
LIST OF TOPICS
PRINT THIS ARTICLE
by Stella Osoba, CMT
The Commodity Channel Index (CCI) is a popular index developed by Donald Lambert and first published in an edition of the Commodities magazine in 1980. It is named the CCI because Lambert developed the index to help him identify cyclical turns in the commodities market. Since then it has gained popularity for its versatility as it can be applied to stocks, currencies and indices.
Position: N/A
Stella Osoba, CMT
Stella Osoba is a trader and financial writer. She is a frequent contributor to "Technical Analysis of Stocks and Commodities" magazine and "Traders.com Advantage" as well as other financial publications.
PRINT THIS ARTICLE
TECHNICAL INDICATORS
Using The Commodity Channel Index
09/30/20 04:48:02 PMby Stella Osoba, CMT
The Commodity Channel Index (CCI) is a popular index developed by Donald Lambert and first published in an edition of the Commodities magazine in 1980. It is named the CCI because Lambert developed the index to help him identify cyclical turns in the commodities market. Since then it has gained popularity for its versatility as it can be applied to stocks, currencies and indices.
Position: N/A
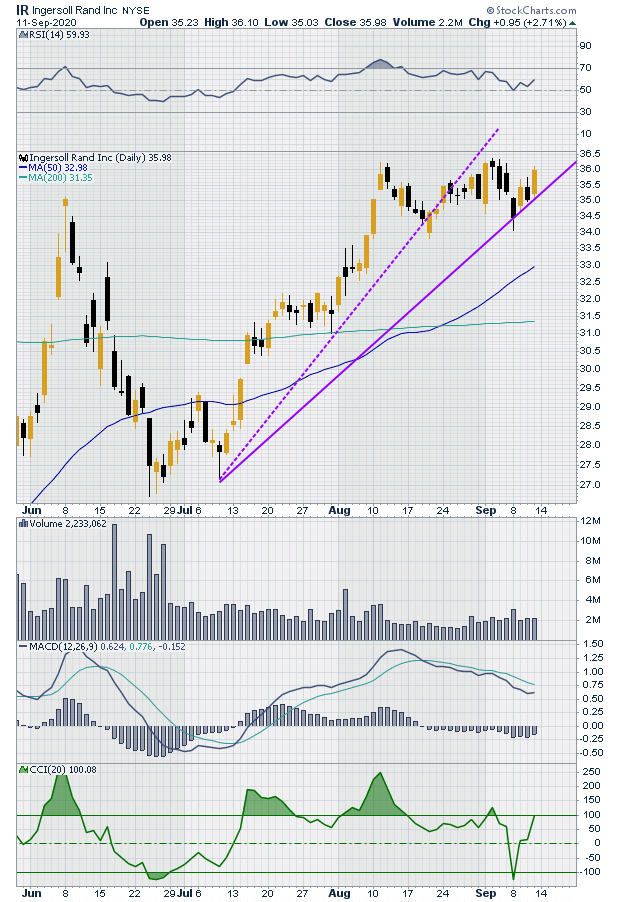
| The CCI has a center line of 0. It is unbounded, which means that it can rise above +100 or below -100. Levels above +100 are generally considered bullish while levels below -100 are considered bearish. To study this indicator in greater detail we will use the chart of Ingersoll Rand Inc. (IR) which has been trending sideways from an uptrend. As of September 11, 2020, the CCI looks set to move into bullish territory once more (See Figure 1). |
| Figure 1 is a short term daily chart reflecting recent price action, showing that IR is in an uptrend. The dotted purple uptrend line has been breached as price took a break from the strong uptrend to trade sideways in a congestion pattern which allows us to draw the solid purple trendline. |
|
| Figure 1. IR Daily Chart. |
| Graphic provided by: StockCharts.com. |
| |
| Figure 2 allows us to see a years worth of price action. The uptrend line is unbroken. There is a golden cross as the 50-day moving average moves above the 200-day moving average which is bullish. The red rectangle in the panel below volume shows that the CCI has been mostly above +100 since its March 2020 lows. When prices move far above or below their average levels, the CCI reflects this by moving far above or below its center line. Often, 100+/- is used to identify overbought or oversold levels. The CCI is a momentum indicator which means it works best when prices are trending and less well when they are in a trading range. |

|
| Figure 2. IR Daily Chart. |
| Graphic provided by: StockCharts.com. |
| |
| When the CCI first moves into overbought territory, this can signal trend strength (see Figure 2). On March 31, 2020, the CCI moved above +100 as price rose from the trend low of March 18, 2020. The CCI followed price as the uptrend strengthened, making higher highs and higher lows. During this time the CCI stayed mostly in overbought territory. |
| As with any indicator, the CCI can be very useful if properly understood and applied. It is unbounded, so overbought and oversold levels are not fixed and may change depending on the particular security traded. Remember that no matter which indicator you are using, confirmation for trades must always come from price. |
Stella Osoba is a trader and financial writer. She is a frequent contributor to "Technical Analysis of Stocks and Commodities" magazine and "Traders.com Advantage" as well as other financial publications.
| E-mail address: | stellaosoba@gmail.com |
Click here for more information about our publications!
Comments
Date:�01/10/23Rank:�5Comment:�

Request Information From Our Sponsors
- StockCharts.com, Inc.
- Candle Patterns
- Candlestick Charting Explained
- Intermarket Technical Analysis
- John Murphy on Chart Analysis
- John Murphy's Chart Pattern Recognition
- John Murphy's Market Message
- MurphyExplainsMarketAnalysis-Intermarket Analysis
- MurphyExplainsMarketAnalysis-Visual Analysis
- StockCharts.com
- Technical Analysis of the Financial Markets
- The Visual Investor
- VectorVest, Inc.
- Executive Premier Workshop
- One-Day Options Course
- OptionsPro
- Retirement Income Workshop
- Sure-Fire Trading Systems (VectorVest, Inc.)
- Trading as a Business Workshop
- VectorVest 7 EOD
- VectorVest 7 RealTime/IntraDay
- VectorVest AutoTester
- VectorVest Educational Services
- VectorVest OnLine
- VectorVest Options Analyzer
- VectorVest ProGraphics v6.0
- VectorVest ProTrader 7
- VectorVest RealTime Derby Tool
- VectorVest Simulator
- VectorVest Variator
- VectorVest Watchdog