HOT TOPICS LIST
- MACD
- Fibonacci
- RSI
- Gann
- ADXR
- Stochastics
- Volume
- Triangles
- Futures
- Cycles
- Volatility
- ZIGZAG
- MESA
- Retracement
- Aroon
INDICATORS LIST
LIST OF TOPICS
PRINT THIS ARTICLE
by Gary Grosschadl
The chart has established a large symmetrical pattern affording trading opportunities as this pattern tries to build and resolve.
Position: Buy
Gary Grosschadl
Independent Canadian equities trader and technical analyst based in Peterborough
Ontario, Canada.
PRINT THIS ARTICLE
SYMMETRICAL TRIANGLE
Manulife Financial Corp.'s Outlook
01/09/03 10:36:07 AMby Gary Grosschadl
The chart has established a large symmetrical pattern affording trading opportunities as this pattern tries to build and resolve.
Position: Buy
| On the Canadian front, Manulife, about twice as big as Canada Life, led the industry in size until rival Sun Life Financial Services of Canada Inc. took over Clarica Life Insurance Co. earlier this year. Now it's seeking to regain the Number 1 spot among Canadian insurers, and has formally launched a bid for all Canada Life shares it does not own. Is this important to the pure chart reader looking for trading opportunities in the shorter term? Not really since the chart is most likely already reflecting this development. |
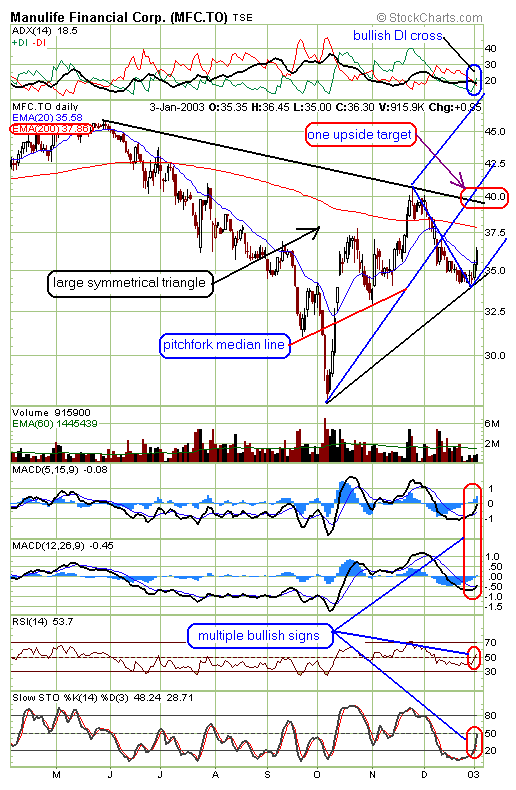
| For the sake of clarity, try to ignore the blue "pitchfork lines" in this part of the analysis. The symmetrical pattern is generally a neutral pattern in that the outcome can break either way with obvious upside and downside implications. While traders wait for the bigger move that comes with likely resolution, there is a possible trading opportunity within this pattern. |

|
| Graphic provided by: StockCharts.com. |
| |
| The stock has recently reversed course to some short-term strength above its 20-day EMA. Now I see two upside possibilites in the short-term. First, a move to test the 200-day EMA (currently 37.86 as shown on chart) and if this succeeds, a further move to possibly challenge the triangle's upper trendline in the $39-40 zone. |
| Checking with some indicator analysis gives some added credibility for my bullish stance. The directional movement indicator (top of chart) represented by the components ADX and DIs, shows a bullish development. The DIs have just managed a bullish cross whereby the positive power component +DI assumes the dominant position on top. Watch the direction of the black ADX line to confirm further bullishness. For trend strength to continue bullishly, this ADX line should soon turn upwards and move above the 20 level. Meanwhile stochastics have turned bullishly up and RSI has risen above the 50 level. Looking at the MACD (moving average convergence/divergence) I note that both the longer term and shorter term series have both managed bullish crosses. When both series are in agreement it makes for a stronger signal. Further bullishness should carry these beyond the zero line (which can at times be a stall point - something to be alert for). |
| Now for the Andrews Pitchfork analysis to add some icing on the cake. In my previous article I introduced this tool which has been around for years. Checking back in the archives others have also written about this intriguing tool-- "Andrews Pitchfork," Traders.com Advantage, posted 07/13/01 by Dennis Peterson-- is a good read. I chose three significant points on the chart to draw the pitchfork, the center line being called the median line. The analysis theory says that a move to the center median line is likely 80% of the time. I can't personally vouch for this but will keep an open mind as I watch with interest. Bear in mind you do have to consider the variations in choosing which three points to anchor the pitchfork. But studying and practicing with any tool leads to greater understanding and confidence going forward. This chart suggests that the move to test the upper triangle trendline, as previously discussed, is reinforced by the theory of a possible pitchfork move to the median line. A good goal of technical analysis is to show a credible weight of evidence pointing to a likely outcome. This does not guarantee success but does serve to tilt the odds in one's favor more often than not. So in summary I have presented a good argument for a bullish move to test upside targets, one of which is the area at or close to the symmetrical triangle upper trendline. Once there a bigger move may ensue, the question then will be. . . which way? |
Independent Canadian equities trader and technical analyst based in Peterborough
Ontario, Canada.
| Website: | www.whatsonsale.ca/financial.html |
| E-mail address: | gwg7@sympatico.ca |
Click here for more information about our publications!
PRINT THIS ARTICLE

Request Information From Our Sponsors
- VectorVest, Inc.
- Executive Premier Workshop
- One-Day Options Course
- OptionsPro
- Retirement Income Workshop
- Sure-Fire Trading Systems (VectorVest, Inc.)
- Trading as a Business Workshop
- VectorVest 7 EOD
- VectorVest 7 RealTime/IntraDay
- VectorVest AutoTester
- VectorVest Educational Services
- VectorVest OnLine
- VectorVest Options Analyzer
- VectorVest ProGraphics v6.0
- VectorVest ProTrader 7
- VectorVest RealTime Derby Tool
- VectorVest Simulator
- VectorVest Variator
- VectorVest Watchdog
- StockCharts.com, Inc.
- Candle Patterns
- Candlestick Charting Explained
- Intermarket Technical Analysis
- John Murphy on Chart Analysis
- John Murphy's Chart Pattern Recognition
- John Murphy's Market Message
- MurphyExplainsMarketAnalysis-Intermarket Analysis
- MurphyExplainsMarketAnalysis-Visual Analysis
- StockCharts.com
- Technical Analysis of the Financial Markets
- The Visual Investor
