

HOT TOPICS LIST
- MACD
- Fibonacci
- RSI
- Gann
- ADXR
- Stochastics
- Volume
- Triangles
- Futures
- Cycles
- Volatility
- ZIGZAG
- MESA
- Retracement
- Aroon
INDICATORS LIST
LIST OF TOPICS
PRINT THIS ARTICLE
by Stella Osoba, CMT
Gaps are periods on charts during which no trading has taken place. They are represented by blank spaces. They can form on any time frame and represent periods when high buying or selling volume, often after market close or before market open, has taken place. Understanding gaps and their significance can be extremely useful for getting in and staying in the trade.
Position: N/A
Stella Osoba, CMT
Stella Osoba is a trader and financial writer. She is a frequent contributor to "Technical Analysis of Stocks and Commodities" magazine and "Traders.com Advantage" as well as other financial publications.
PRINT THIS ARTICLE
GAPS
Mind The Gap
10/15/20 04:07:10 PMby Stella Osoba, CMT
Gaps are periods on charts during which no trading has taken place. They are represented by blank spaces. They can form on any time frame and represent periods when high buying or selling volume, often after market close or before market open, has taken place. Understanding gaps and their significance can be extremely useful for getting in and staying in the trade.
Position: N/A
| Gaps are named differently, depending on where they appear in the chart. The most often seen type of gap is the common gap which has little trading significance and is often closed quickly. The more important types of gap which we will focus on in this article are the breakaway gaps, runaway gaps, or measuring gaps, and exhaustion gaps. It is often the case that hindsight is the only way you can name some gaps with certainty. But it helps to get in the trade early enough after the breakaway gap has formed so that you start seeing profits before reactions force you prematurely out of the trade. |
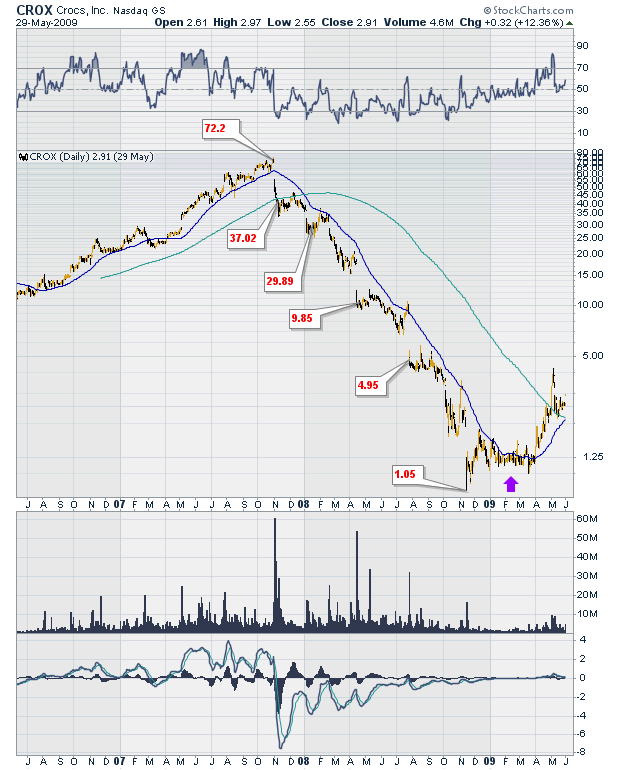
| From November 1, 2007 and November 13, 2008, Crocs, Inc (CROX) went on an impressive downtrend. It fell from $72 a share to close at $1.5 per share (See Figure 1). During its decline, CROX gapped down several times and the trader who went short at the right time and held on would have made substantial profits. On November 1, 2007 CROX gapped down in what would be the start of its downtrend. The position of the gap indicates it was a Breakaway gap. Often breakaway gaps break out of congestion areas. In this case CROX had been in an uptrend. There was no preexisting congestion period or sideways trading to gap out of. The trend reversed from up to down with no warning other than the breakaway gap. Trading in real time could have resulted in some confusion as to the type of gap this was. The volume was extremely high which pointed to good confirmation that the trend was changing, but waiting for more information would have been entirely acceptable. |
|
| Figure 1. Daily chart for CROX. |
| Graphic provided by: StockCharts.com. |
| |
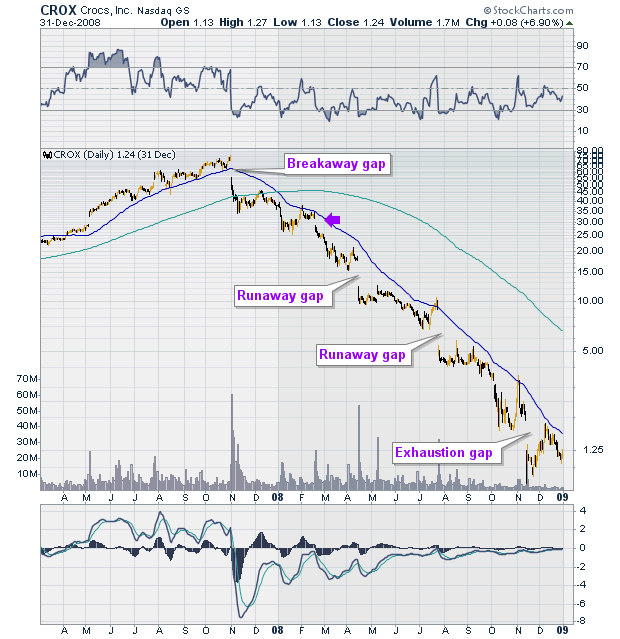
| in Figure 2, a purple arrow shows another gap below the first, this could be the confirmation of the trend change, otherwise the resistance provided by the downward sloping 50-day moving average should have been all the information one needed that the trend had definitely changed from up to down. Prior to the second gap the Devil's Cross, formed by the 200-day moving average moving above the 50-day moving average,was an unmistakable bearish signal. |
|
| Figure 2. Daily chart for CROX showing multiple gaps. |
| Graphic provided by: StockCharts.com. |
| |
| A runaway gap will occur during a defined trend. Runaway gaps are very useful sign posts for traders. They are often called measuring gaps because their appearance signals the trend is about halfway through. Significant interest in the trend from traders piling in means that the gap is often accompanied by a definite increase in volume. In Figure 2 I have noted two gaps which I have labelled runaway gaps. I am able to do this only with the benefit of hindsight. The first runaway gap is easier to label, the second not so much. But if the principle we are guided by is that we stay in the trade until there is a signal to show that it is no longer working, then we would have held on or added to our positions after the first and maybe second runaway gap. |
| The exhaustion gap is the third type of gap I have labelled on the chart. These types of gaps are found near the end of the trend. It suggests that the current trend is exhausted and likely to end shortly. We cannot know for sure that a gap is an exhaustion gap before the trend ends, but we can be alerted to this possibility. The purple up arrow on Figure 1 shows that shortly after the exhaustion gap the trend did change to sideways. Then for the next four months price went nowhere as a base was built. Anytime during this period would have been a good time to close the trade. Studying historical charts is a good way to hone your trading skills because as the famous saying goes, "history does not repeat itself, but it often rhymes". |
Stella Osoba is a trader and financial writer. She is a frequent contributor to "Technical Analysis of Stocks and Commodities" magazine and "Traders.com Advantage" as well as other financial publications.
| E-mail address: | stellaosoba@gmail.com |
Click here for more information about our publications!
PRINT THIS ARTICLE

Request Information From Our Sponsors
- StockCharts.com, Inc.
- Candle Patterns
- Candlestick Charting Explained
- Intermarket Technical Analysis
- John Murphy on Chart Analysis
- John Murphy's Chart Pattern Recognition
- John Murphy's Market Message
- MurphyExplainsMarketAnalysis-Intermarket Analysis
- MurphyExplainsMarketAnalysis-Visual Analysis
- StockCharts.com
- Technical Analysis of the Financial Markets
- The Visual Investor
- VectorVest, Inc.
- Executive Premier Workshop
- One-Day Options Course
- OptionsPro
- Retirement Income Workshop
- Sure-Fire Trading Systems (VectorVest, Inc.)
- Trading as a Business Workshop
- VectorVest 7 EOD
- VectorVest 7 RealTime/IntraDay
- VectorVest AutoTester
- VectorVest Educational Services
- VectorVest OnLine
- VectorVest Options Analyzer
- VectorVest ProGraphics v6.0
- VectorVest ProTrader 7
- VectorVest RealTime Derby Tool
- VectorVest Simulator
- VectorVest Variator
- VectorVest Watchdog