HOT TOPICS LIST
- MACD
- Fibonacci
- RSI
- Gann
- ADXR
- Stochastics
- Volume
- Triangles
- Futures
- Cycles
- Volatility
- ZIGZAG
- MESA
- Retracement
- Aroon
INDICATORS LIST
LIST OF TOPICS
PRINT THIS ARTICLE
by Stella Osoba, CMT
When managing a position, we often ask ourselves when is the best time to sell to preserve profits, and if we do sell, when to get back in or reverse our position. The Parabolic SAR can help to remove some of that guesswork.
Position: N/A
Stella Osoba, CMT
Stella Osoba is a trader and financial writer. She is a frequent contributor to "Technical Analysis of Stocks and Commodities" magazine and "Traders.com Advantage" as well as other financial publications.
PRINT THIS ARTICLE
WILDER'S PARA SAR
Parabolic SAR
09/23/20 02:41:12 PMby Stella Osoba, CMT
When managing a position, we often ask ourselves when is the best time to sell to preserve profits, and if we do sell, when to get back in or reverse our position. The Parabolic SAR can help to remove some of that guesswork.
Position: N/A
| The Parabolic SAR is an indicator developed by J. Welles Wilder. He also developed the Average True Range (ATR), Directional Movement (ADX) and the Relative Strength Index (RSI). In this short piece, we will content ourselves with an overview of the Parabolic SAR. The SAR stands for Stop and Reverse. The parabolic SAR is a trend-following price and time based trading system and it is designed so that one is always in the market; either short or long. |
| As long as the indicator is below prices, prices are rising and one should be long. When the indicator is above price then the indicator is signaling that one should be short because prices are falling. To illustrate we will use a chart of Zoom Video Communications, Inc. (ZM), the popular video communications platform. |
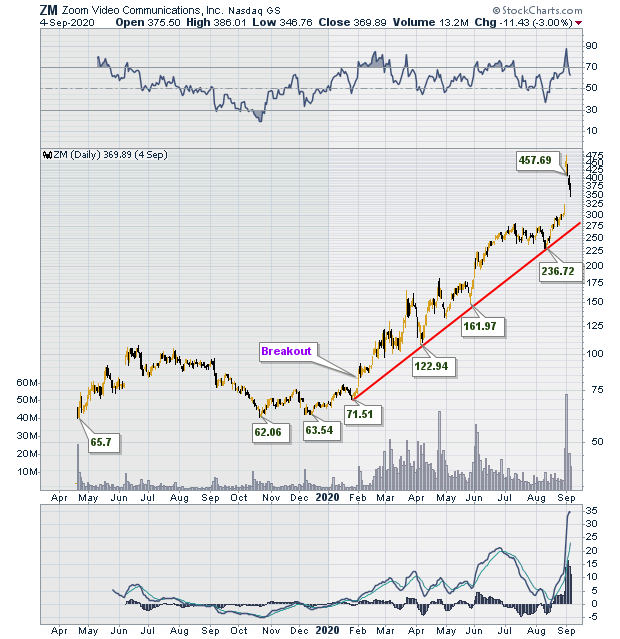
| ZM debuted on the Nasdaq on April 18, 2019, on which day its share price closed at $62. After entering a basing pattern into early 2020, price broke out on February 3, 2020 (See Figure 1). Figure 1 is a daily chart of ZM showing price action since it began trading on the Nasdaq. After breakout (indicated on the chart) ZM proceeded to enter a nice uptrend; higher highs followed higher lows for the most part. The trend line (red line) remains unbroken. |

|
| Figure 1. Daily chart for ZM. |
| Graphic provided by: StockCharts.com. |
| |
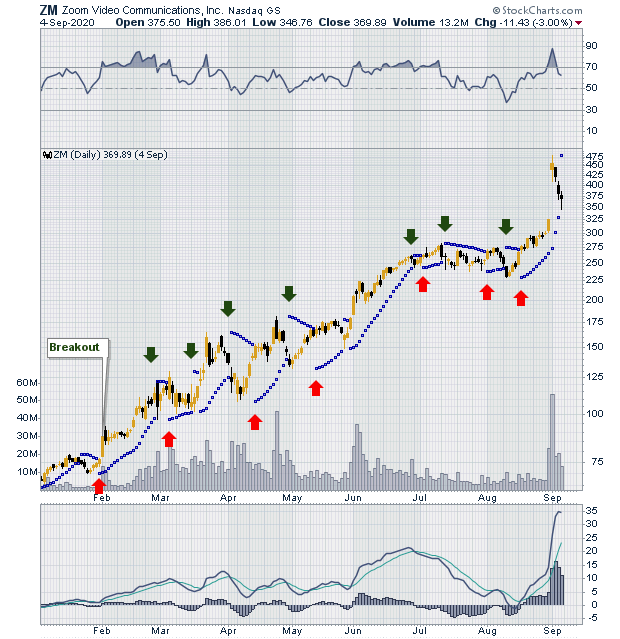
| But the question for traders who do not want to simply buy and hold is; when is the best time to sell to preserve profits and when to get back in or reverse positions? This is where the Parabolic SAR can be very useful in helping to guide decision making. Figure 2 is a daily chart of ZM showing price action since breakout. The red arrows show the buy signal indicated by the Parabolic SAR and the green arrows show the sell signals. While in a strong uptrend such as the one ZM is currently in, it is to be expected that many of the sell signals will be unprofitable, but this is more than made up for by the profitability of the buy signals. Trading the system means that you take the signal on the first day of the switch from up to down or vice versa. You stay in the trade until the indicator reverses and then you take the opposite trade. As with any mechanical system such as this, it is important not to second guess yourself and follow the system as it was meant to be used. |

|
| Figure 2. Daily chart of ZM showing price action since breakout and the parabolic SAR indicator. |
| Graphic provided by: StockCharts.com. |
| |
| I have used default settings for this illustration. The sensitivity of the indicator can be increased or decreased by changing the default settings. As with any other indicator, it's important to select a few indicators and study them thoroughly so you are comfortable using them. Also remember that the parabolic SAR is a trending system and therefore it works best with trending securities. Welles Wilder estimated that securities will trend approximately 30% of the time. To learn more about this indicator refer to J. Welles Wilder's "New Concepts in Technical Trading Systems". |
Stella Osoba is a trader and financial writer. She is a frequent contributor to "Technical Analysis of Stocks and Commodities" magazine and "Traders.com Advantage" as well as other financial publications.
| E-mail address: | stellaosoba@gmail.com |
Click here for more information about our publications!
Comments
Date: 09/28/20Rank: 5Comment:

Request Information From Our Sponsors
- StockCharts.com, Inc.
- Candle Patterns
- Candlestick Charting Explained
- Intermarket Technical Analysis
- John Murphy on Chart Analysis
- John Murphy's Chart Pattern Recognition
- John Murphy's Market Message
- MurphyExplainsMarketAnalysis-Intermarket Analysis
- MurphyExplainsMarketAnalysis-Visual Analysis
- StockCharts.com
- Technical Analysis of the Financial Markets
- The Visual Investor
- VectorVest, Inc.
- Executive Premier Workshop
- One-Day Options Course
- OptionsPro
- Retirement Income Workshop
- Sure-Fire Trading Systems (VectorVest, Inc.)
- Trading as a Business Workshop
- VectorVest 7 EOD
- VectorVest 7 RealTime/IntraDay
- VectorVest AutoTester
- VectorVest Educational Services
- VectorVest OnLine
- VectorVest Options Analyzer
- VectorVest ProGraphics v6.0
- VectorVest ProTrader 7
- VectorVest RealTime Derby Tool
- VectorVest Simulator
- VectorVest Variator
- VectorVest Watchdog
