

HOT TOPICS LIST
- MACD
- Fibonacci
- RSI
- Gann
- ADXR
- Stochastics
- Volume
- Triangles
- Futures
- Cycles
- Volatility
- ZIGZAG
- MESA
- Retracement
- Aroon
INDICATORS LIST
LIST OF TOPICS
PRINT THIS ARTICLE
by Stella Osoba, CMT
One mistake that some people make is to look at a chart in a defined trend and think because it has reached the top of the chart (in an uptrend), price has to decline. The upper right of the chart is not resistance. It is simply a line generated by the computer and will adjust according to what price does.
Position: N/A
Stella Osoba, CMT
Stella Osoba is a trader and financial writer. She is a frequent contributor to "Technical Analysis of Stocks and Commodities" magazine and "Traders.com Advantage" as well as other financial publications.
PRINT THIS ARTICLE
TECHNICAL ANALYSIS
The Upper Right Of The Chart Is Not Resistance
09/10/20 03:25:16 PMby Stella Osoba, CMT
One mistake that some people make is to look at a chart in a defined trend and think because it has reached the top of the chart (in an uptrend), price has to decline. The upper right of the chart is not resistance. It is simply a line generated by the computer and will adjust according to what price does.
Position: N/A
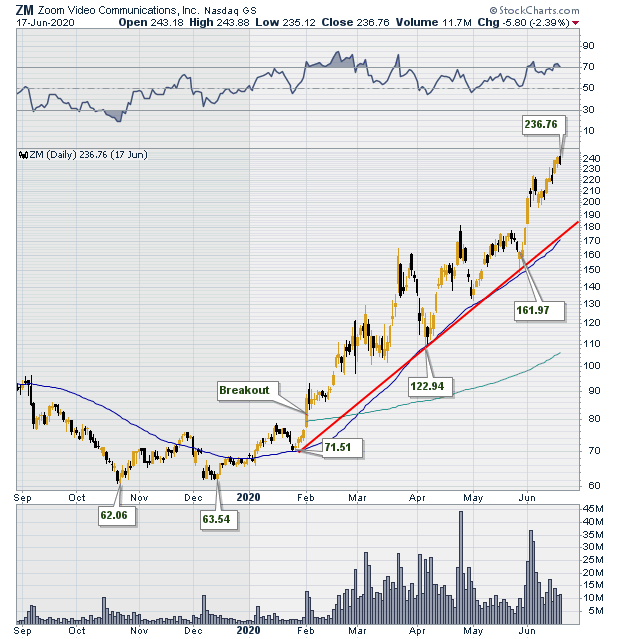
| To illustrate this point let us use Zoom Video Communications, Inc. (ZM). ZM is a video conferencing app that has gained immense popularity in 2020 as a result of the Covid pandemic. Work-from-home has caused this app to gain widespread use among business users, schools and a variety of users worldwide. |
|
| Figure 1. Daily chart for ZM through June 2020. |
| Graphic provided by: StockCharts.com. |
| |
| Figure 1 is a daily chart of ZM showing the stock in a clear uptrend. Price broke out from a basing pattern on February 3, 2020, and proceeded to march higher as the company gained increasing numbers of daily meeting participants. From 10 million daily meeting participants in December 2019, the number grew to 200 million by March 2020, and by April 2020 this figure had grown to 300 million. |
| It is tempting when trading a position to look at a stock in a strong trend and start to anticipate its end because everything that goes up must eventually come down. But just looking at a chart and using the available information before us may often not be enough for us to predict the correct end of a strong trend. Our biases lead us to look for danger because if our position is performing well, we fear the eventual decline which could lead to a reduction of our profits and even losses. Resistance is above price. It is drawn as a horizontal line connecting at least two price peaks were selling becomes stronger than buying. It is often easy to mistake the horizontal line that forms the top of a price chart for resistance and therefore it is easy to then anticipate that price at the top right of the chart is where selling will come in. |
|
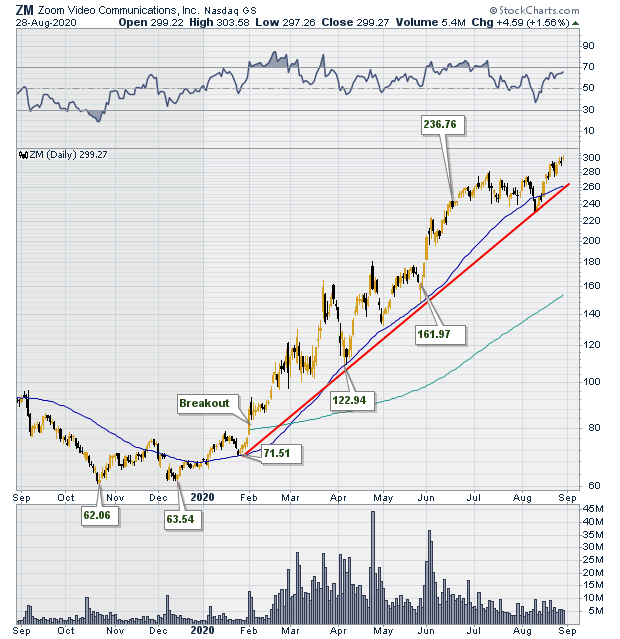
| Figure 2. Daily chart for ZM through August 2020. |
| Graphic provided by: StockCharts.com. |
| |
| Look at Figure 2 which extends the price action of ZM into August 2020. The uptrend is still intact. The only thing that has changed is that the horizontal line forming the upper boundaries of the chart has moved up further. |
| We need to remember that trading has many moving parts that can interfere with our judgment. Being cognizant of this fact helps us minimize our biases so that we are focused and are paying attention only to those factors that are giving us useful information. |
Stella Osoba is a trader and financial writer. She is a frequent contributor to "Technical Analysis of Stocks and Commodities" magazine and "Traders.com Advantage" as well as other financial publications.
| E-mail address: | stellaosoba@gmail.com |
Click here for more information about our publications!
PRINT THIS ARTICLE

Request Information From Our Sponsors
- StockCharts.com, Inc.
- Candle Patterns
- Candlestick Charting Explained
- Intermarket Technical Analysis
- John Murphy on Chart Analysis
- John Murphy's Chart Pattern Recognition
- John Murphy's Market Message
- MurphyExplainsMarketAnalysis-Intermarket Analysis
- MurphyExplainsMarketAnalysis-Visual Analysis
- StockCharts.com
- Technical Analysis of the Financial Markets
- The Visual Investor
- VectorVest, Inc.
- Executive Premier Workshop
- One-Day Options Course
- OptionsPro
- Retirement Income Workshop
- Sure-Fire Trading Systems (VectorVest, Inc.)
- Trading as a Business Workshop
- VectorVest 7 EOD
- VectorVest 7 RealTime/IntraDay
- VectorVest AutoTester
- VectorVest Educational Services
- VectorVest OnLine
- VectorVest Options Analyzer
- VectorVest ProGraphics v6.0
- VectorVest ProTrader 7
- VectorVest RealTime Derby Tool
- VectorVest Simulator
- VectorVest Variator
- VectorVest Watchdog