

HOT TOPICS LIST
- MACD
- Fibonacci
- RSI
- Gann
- ADXR
- Stochastics
- Volume
- Triangles
- Futures
- Cycles
- Volatility
- ZIGZAG
- MESA
- Retracement
- Aroon
INDICATORS LIST
LIST OF TOPICS
PRINT THIS ARTICLE
by Billy Williams
30 million people out of work, the economy contracting, but, for WDAY, the band plays on (but for how long)
Position: Buy
Billy Williams
Billy Williams has been trading the markets for 27 years, specializing in momentum trading with stocks and options.
PRINT THIS ARTICLE
TRIANGLES
WDAY And Stock Market Divergence From Reality
09/10/20 03:13:51 PMby Billy Williams
30 million people out of work, the economy contracting, but, for WDAY, the band plays on (but for how long)
Position: Buy
| "The stock market can go up longer than you can stay solvent." - Unknown Anyone else ready to call 2020 a year? The markets have been a roller-coaster with uncertainty hanging in the air as the economy tries to digest massive unemployment and sales decline. Businesses are having to adapt by having a greater online presence to make up for lost in-store sales in the wake of Pier 1 declaring bankruptcy. Adding to the misery, 30 million Americans are out of work with that number likely going higher. But, one elusive fact that many are grappling with is how does the stock market keep going up? Remember that 6 trillion dollar liquidity dump by the Federal Reserve? Retailers and restaurants may be struggling but the Fed's money presses have been operating in overtime to get money into the banking system. All of that money is flush into the system and overflowing on the bank's balance sheets waiting to spill over on to Wall Street. This seems to be as if the stock market has taken a "madness pill" by shrugging off economic realities and continuing to trade higher. Wall Street has always liked free money from the Fed and it shows from going from extreme in price lows to now setting new price high records. |
|
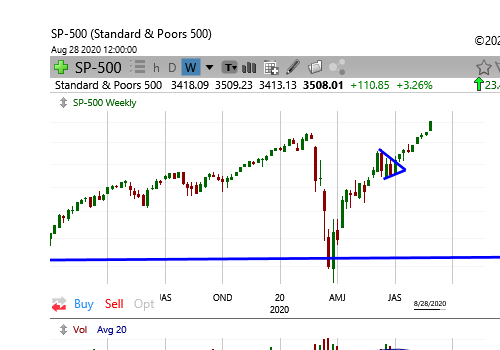
| Figure 1. A weekly Bullish Symmetrical Triangle formed in the SPX before it broke its upper trendline and pushed higher. This a strong signal that the Bulls have control of the market for the long-term and the market will go higher. |
| Graphic provided by: TC2000.com. |
| |
| This divergence from reality — stock market highs versus COVID-19'S negative economic impact — will catch up to the markets eventually but, for now, it pays to follow the trend. That said, should you chase bank stocks and financial services? That is a firm "maybe" as long as you make trailing stop loss orders your best friend and chief tool of risk management. That, and the size of your overall position with a strong bias towards using options in your strategy. However, what about real "alpha". Real wealth-building stocks that are emerging from the lower rung of the stock picker's ladder and moving to the higher ground of tomorrow's stock leadership? To do that, you need to watch for shifts in Group Leadership as the weaker hands give way to the stronger hands of high stock performance. Companies with strong value propositions that ride the wave of surging demand for upcoming products and services. Once they do, they have crossed the Rubicon of average performance and staked their claim for leadership to take the market into higher territory. More importantly, not on the backs of cheap money and the Fed's printing presses, but by offering real value to a hungry market. Workday, Inc. (WDAY) provides worldwide enterprise cloud service applications to help its customers manage critical functions along with their capital resources, both human and financial. These applications become more important in the current and post-COVID-19 world that we live and do business in. |
|
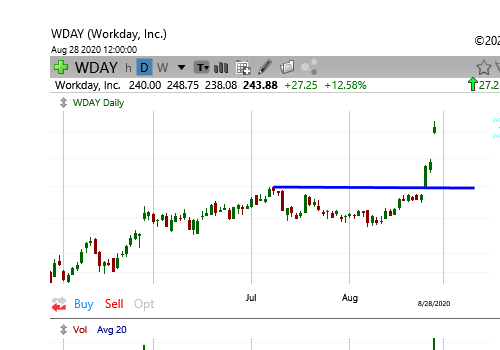
| Figure 2. WDAY formed a Cup & Handle on the weekly chart. Here, on the daily price chart, the stock broke above its buy point of $200 to signal a buy. The signal was confirmed by trading volume surging 400% of its 20-day average volume on the day of the price breakout. |
| Graphic provided by: TC2000.com. |
| |
| This makes the industry compelling but even more so as its Industry Group Rating is ranked 8 out of 197 along with improving fundamentals. Taking a closer look, you see that while it lags in Relative Strength (RS) at 87 and ranking at 26, which combined with fundamentals makes it a candidate worth watching. Fundamentally, WDAY is a workhorse. Earnings Per Share (EPS) change from last quarter was 91%; the last 3 quarters average EPS growth was a whopping 39%; the last 3 years EPS growth rate has experienced year-over-year consecutive growth; the 3 years sales growth rate is 30%; and the annual Return On Equity (ROE) is 20.9%. On the technical side, WDAY is in a solid uptrend which puts it in sync with the overall market. The S&P 500 Index (SPX) has emerged out of a Bullish Symmetrical Triangle pattern and has traded higher to a new record price high and erased the losses from earlier this year. This has put "wind in the sails" of WDAY which helped the stock climb its way out of a hole from the lows of late March of this year. Better, the stock formed a weekly Cup & Handle pattern where price broke out of the Handle portion of the pattern above $200 and signaling a buy. This was further confirmed by volume which surged almost 400% of the 20-day average volume which continued to rise in the following days. The stock went on to ratchet up 20+% gains in the following days including a huge price gap. |
| The stock is poised to go higher but with such a huge gap in price lying below where its currently trading, the gap could act as a weight on WDAY's current trajectory. Gaps usually, on average, close at some point, so the odds weigh on WDAY that price will go lower before it goes higher. That is not a hard-and-fast rule but, generally, that's what probabilities say will happen sooner before later. To play the stock, you have to wait and see what price will do. Watch for pullbacks and wait for the 50-day and 200-day Simple Moving Averages to catch up and for price to consolidate around those price points. Buy in chunks, adding to your position each time that the Bulls prove their strength by pushing the stock to new highs but trail a stop closely behind. I would also play the long-term by using the weekly price chart to help show you where to buy. The new highs won't show as frequently on the weekly charts but your position will be stronger as long as the SPX remains in an uptrend. If the SPX falters, then hold your position but keep your stops close by to control risk. |
Billy Williams has been trading the markets for 27 years, specializing in momentum trading with stocks and options.
| Company: | StockOptionSystem.com |
| E-mail address: | stockoptionsystem.com@gmail.com |
Traders' Resource Links | |
| StockOptionSystem.com has not added any product or service information to TRADERS' RESOURCE. | |
Click here for more information about our publications!
PRINT THIS ARTICLE

Request Information From Our Sponsors
- VectorVest, Inc.
- Executive Premier Workshop
- One-Day Options Course
- OptionsPro
- Retirement Income Workshop
- Sure-Fire Trading Systems (VectorVest, Inc.)
- Trading as a Business Workshop
- VectorVest 7 EOD
- VectorVest 7 RealTime/IntraDay
- VectorVest AutoTester
- VectorVest Educational Services
- VectorVest OnLine
- VectorVest Options Analyzer
- VectorVest ProGraphics v6.0
- VectorVest ProTrader 7
- VectorVest RealTime Derby Tool
- VectorVest Simulator
- VectorVest Variator
- VectorVest Watchdog
- StockCharts.com, Inc.
- Candle Patterns
- Candlestick Charting Explained
- Intermarket Technical Analysis
- John Murphy on Chart Analysis
- John Murphy's Chart Pattern Recognition
- John Murphy's Market Message
- MurphyExplainsMarketAnalysis-Intermarket Analysis
- MurphyExplainsMarketAnalysis-Visual Analysis
- StockCharts.com
- Technical Analysis of the Financial Markets
- The Visual Investor