

HOT TOPICS LIST
- MACD
- Fibonacci
- RSI
- Gann
- ADXR
- Stochastics
- Volume
- Triangles
- Futures
- Cycles
- Volatility
- ZIGZAG
- MESA
- Retracement
- Aroon
INDICATORS LIST
LIST OF TOPICS
PRINT THIS ARTICLE
by Stella Osoba, CMT
Sometimes it's useful to go back to basics to remind ourselves of concepts that underpin successful trading. One such concept is the breakout.
Position: N/A
Stella Osoba, CMT
Stella Osoba is a trader and financial writer. She is a frequent contributor to "Technical Analysis of Stocks and Commodities" magazine and "Traders.com Advantage" as well as other financial publications.
PRINT THIS ARTICLE
BREAKOUTS
Recognizing Breakouts
09/03/20 04:21:37 PMby Stella Osoba, CMT
Sometimes it's useful to go back to basics to remind ourselves of concepts that underpin successful trading. One such concept is the breakout.
Position: N/A
| There are many ways breakouts will happen on a chart. Sometimes a breakout will happen after a low has formed and price has trended for weeks or months, forming a base from which a breakout will happen. Other times the trend will be well established, price will then take a break from making higher highs or lower lows and begin to trend sideways, forming what is also called a rectangle. The breakout then happens during a preexisting trend up or down. It is useful to recognize how and when breakouts form because entering on a breakout is one of the best ways to maximize trading profits. |
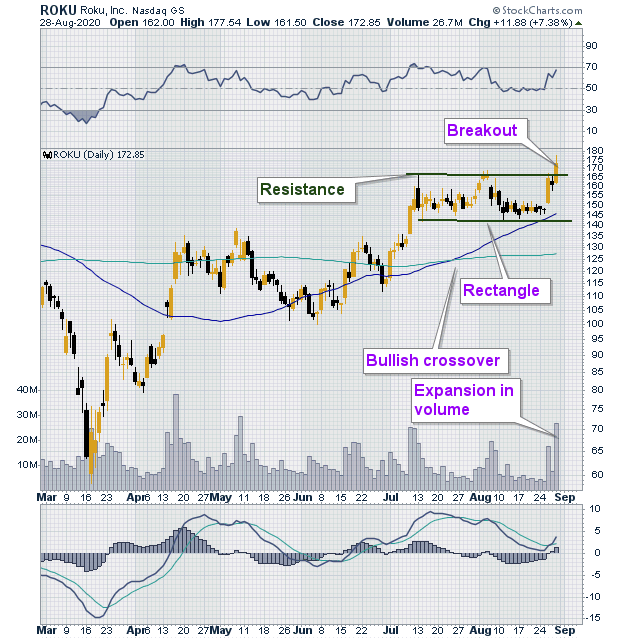
| ROKU Inc. (ROKU) provides us a useful illustration of a breakout mid-uptrend. Figure 1 shows that ROKU followed the rest of the market from February to March 2020 into a steep decline which then staged a V-shaped recovery. The recovery saw price making a series of higher highs and higher lows in an orderly up trend. The 50-day moving average began to move upwards and soon crossed above the 200-day moving average. |
|
| Figure 1. Daily chart for ROKU. |
| Graphic provided by: StockCharts.com. |
| |
| On July 13, 2020, price formed a strong bearish candle with a long upper tail and then proceeded to trade sideways over the next couple of months. Figure 1 shows that the chart pattern it formed was a rectangle. The rectangle is a continuation pattern formed by two parallel lines above and below price. As with other trend lines, always remember that price has to touch each line at least twice for a trend line to be valid. |
| The first time price touched the upper trend line on August 4 and 5, the resistance line held. Price moved lower and tested the lower tend line and that line acting as support also held. The breakout did not come until August 28, 2020, when a strong bullish candle formed breaking through resistance on expansive volume. Valid breakouts will often occur with volume that is at least twice that of the volume on the day prior to the breakout. In this case volume on the day prior to breakout was about 7.4 million, while volume on the day of breakout was 26.7 million, which is almost four times the volume of the prior day. |
| Technical analysis is a method of using probabilities in our favor. Probabilities mean that there is a possibility that all patterns can fail. Trading therefore becomes a game of taking intelligent risk. Therefore, one must be prepared for anything. Since price can only go in three directions, up, down or sideways, assess the likelihood of all three happening with clarity and equanimity so that you are not surprised or frozen to inaction when the unexpected happens. |
Stella Osoba is a trader and financial writer. She is a frequent contributor to "Technical Analysis of Stocks and Commodities" magazine and "Traders.com Advantage" as well as other financial publications.
| E-mail address: | stellaosoba@gmail.com |
Click here for more information about our publications!
Comments
Date:�09/06/20Rank:�5Comment:�

Request Information From Our Sponsors
- VectorVest, Inc.
- Executive Premier Workshop
- One-Day Options Course
- OptionsPro
- Retirement Income Workshop
- Sure-Fire Trading Systems (VectorVest, Inc.)
- Trading as a Business Workshop
- VectorVest 7 EOD
- VectorVest 7 RealTime/IntraDay
- VectorVest AutoTester
- VectorVest Educational Services
- VectorVest OnLine
- VectorVest Options Analyzer
- VectorVest ProGraphics v6.0
- VectorVest ProTrader 7
- VectorVest RealTime Derby Tool
- VectorVest Simulator
- VectorVest Variator
- VectorVest Watchdog
- StockCharts.com, Inc.
- Candle Patterns
- Candlestick Charting Explained
- Intermarket Technical Analysis
- John Murphy on Chart Analysis
- John Murphy's Chart Pattern Recognition
- John Murphy's Market Message
- MurphyExplainsMarketAnalysis-Intermarket Analysis
- MurphyExplainsMarketAnalysis-Visual Analysis
- StockCharts.com
- Technical Analysis of the Financial Markets
- The Visual Investor