HOT TOPICS LIST
- MACD
- Fibonacci
- RSI
- Gann
- ADXR
- Stochastics
- Volume
- Triangles
- Futures
- Cycles
- Volatility
- ZIGZAG
- MESA
- Retracement
- Aroon
INDICATORS LIST
LIST OF TOPICS
PRINT THIS ARTICLE
by Stella Osoba, CMT
Tesla (TSLA) recently admitted a 5:1 stock split after which its stock has shown massive growth and jumped 8%. It could go higher, let's look at its chart.
Position: N/A
Stella Osoba, CMT
Stella Osoba is a trader and financial writer. She is a frequent contributor to "Technical Analysis of Stocks and Commodities" magazine and "Traders.com Advantage" as well as other financial publications.
PRINT THIS ARTICLE
TECHNICAL ANALYSIS
Tesla's Post Stock Split Performance
08/27/20 05:28:27 PMby Stella Osoba, CMT
Tesla (TSLA) recently admitted a 5:1 stock split after which its stock has shown massive growth and jumped 8%. It could go higher, let's look at its chart.
Position: N/A
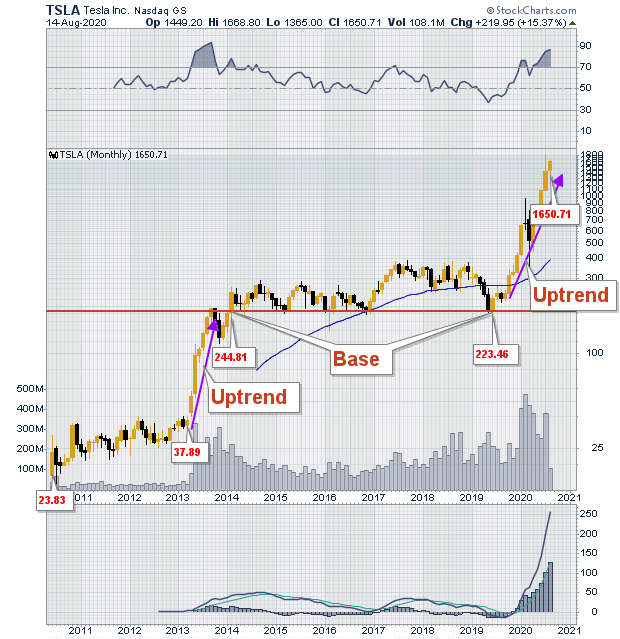
| Figure 1 is a long-term monthly chart of TSLA. The company went public on June 29, 2010 and the chart depicts all ten years of stock price history. TSLA debuted on the NASDAQ at $17 per share and closed on that day at $23.89. For the next three years, the stock meandered along a narrow band, closing on March 1, 2013 at $37.89. |

|
| Figure 1. Monthly chart for TSLA. |
| Graphic provided by: StockCharts.com. |
| |
| At the beginning of April 2013, TSLA broke out of that band and proceeded to trend upwards in a sharp impressive move. Shares topped out at $193 in September of that year before proceeding to form another multi-year sideways trading range. This time, the trading range lasted from early 2014 until late 2019. During this multi-year period, there were tradable trends within the band with the stock price ranging from lows of $169 to highs of $386. |
| However, it was not until October 2019 that the stock began to show signs of breaking out of the band it had taken several years to form. Even though with hindsight we can see the uptrend began in October 2019, the actual breakout from the sideways trading range did not come until December 2019 when the stock broke above its previous highs. Even the market crash in March 2020 did not dent the uptrend, which is depicted on the chart with the purple arrow. |
| TSLA's recent price surge is indeed impressive, but it has taken a five-year base to form. Its price has shot up to a high of $1,668.80. The expected 5:1 stock split will bring the price of individual stocks down into the three hundreds. But will the stock price notch up gains that are as impressive as those we have seen? Look at the past behavior of the stock. When the stock goes quiet and begins to form another multi-year base, its history tells us that that might just be the time to stock up on the stock. |
Stella Osoba is a trader and financial writer. She is a frequent contributor to "Technical Analysis of Stocks and Commodities" magazine and "Traders.com Advantage" as well as other financial publications.
| E-mail address: | stellaosoba@gmail.com |
Click here for more information about our publications!
PRINT THIS ARTICLE

Request Information From Our Sponsors
- StockCharts.com, Inc.
- Candle Patterns
- Candlestick Charting Explained
- Intermarket Technical Analysis
- John Murphy on Chart Analysis
- John Murphy's Chart Pattern Recognition
- John Murphy's Market Message
- MurphyExplainsMarketAnalysis-Intermarket Analysis
- MurphyExplainsMarketAnalysis-Visual Analysis
- StockCharts.com
- Technical Analysis of the Financial Markets
- The Visual Investor
- VectorVest, Inc.
- Executive Premier Workshop
- One-Day Options Course
- OptionsPro
- Retirement Income Workshop
- Sure-Fire Trading Systems (VectorVest, Inc.)
- Trading as a Business Workshop
- VectorVest 7 EOD
- VectorVest 7 RealTime/IntraDay
- VectorVest AutoTester
- VectorVest Educational Services
- VectorVest OnLine
- VectorVest Options Analyzer
- VectorVest ProGraphics v6.0
- VectorVest ProTrader 7
- VectorVest RealTime Derby Tool
- VectorVest Simulator
- VectorVest Variator
- VectorVest Watchdog
