

HOT TOPICS LIST
- MACD
- Fibonacci
- RSI
- Gann
- ADXR
- Stochastics
- Volume
- Triangles
- Futures
- Cycles
- Volatility
- ZIGZAG
- MESA
- Retracement
- Aroon
INDICATORS LIST
LIST OF TOPICS
PRINT THIS ARTICLE
by Stella Osoba, CMT
To trade successfully, one has to fight against and reverse two deep seated instincts: fear and hope. You must fear that a loss will develop into a bigger loss and hope that a successful trade will generate larger profits.
Position: N/A
Stella Osoba, CMT
Stella Osoba is a trader and financial writer. She is a frequent contributor to "Technical Analysis of Stocks and Commodities" magazine and "Traders.com Advantage" as well as other financial publications.
PRINT THIS ARTICLE
TECHNICAL ANALYSIS
Reversing Your Natural Impulses
08/13/20 04:40:04 PMby Stella Osoba, CMT
To trade successfully, one has to fight against and reverse two deep seated instincts: fear and hope. You must fear that a loss will develop into a bigger loss and hope that a successful trade will generate larger profits.
Position: N/A
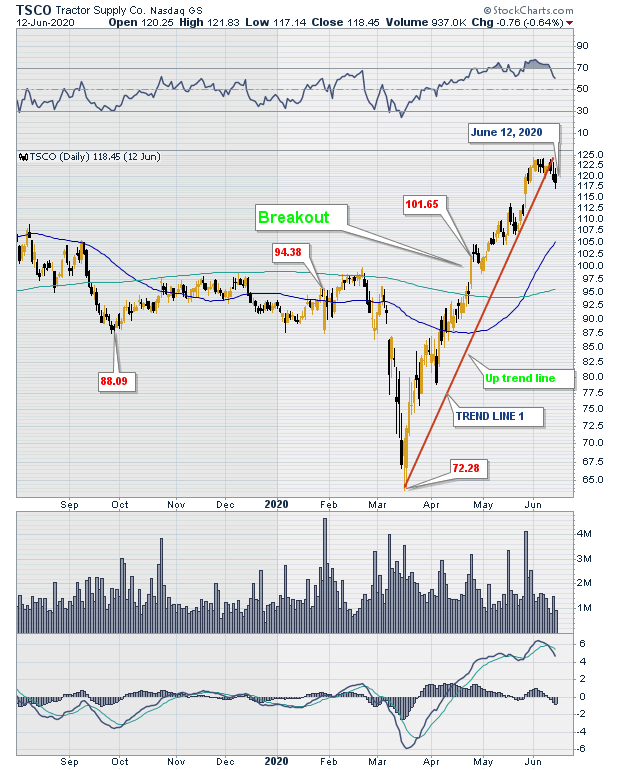
| "The speculator's chief enemies are always boring from within. It is inseparable from human nature to hope and to fear. In speculation when the market goes against you you hope that every day will be the last day — and you lose more than you should had you not listened to hope — to the same ally that is so potent a success-bringer to empire builders and pioneers, big and little." Jesse Livermore To illustrate Livermore's point let's take a look at the daily chart of Tractor Supply Co. (TSCO). After falling in line with the rest of the market plunge in March, it staged a V shaped recovery which developed into a healthy up-trend. See Figure 1. |
|
| Figure 1. Daily chart for TSCO |
| Graphic provided by: StockCharts.com. |
| |
| The breakout or earlier in the V shaped recovery was a chance to get into the trade. As price rose, it eventually became possible to draw a trend line to alert one of a possible reaction or reversal that would put the uptrend at risk. Trend lines are subjective, they can always be adjusted later. Once one is drawn on a price chart, try not to see it as a rigid line which the market is bound to honor. |
| As TSCO's price rose higher it eventually began to move sideways forming several bearish candles which broke through the trend line. Figure 1 ends on a bearish candle formed on June 12, 2020. Would fear have caused you to exit the trade then? Taking a lesson from Livermore, the correct cause of action would have been to hope that the up trend was not over and stay in the trade. |
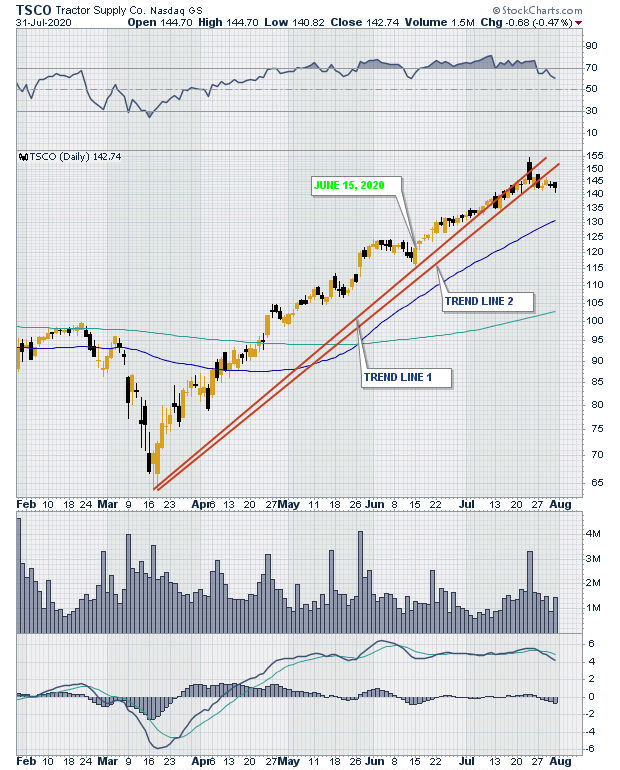
| Figure 2 shows a continuation of the chart from June 15, 2020 when the candle formed was a bullish engulfing. As prices broke higher it became possible to draw another trend line, slightly less steep than trend line 1 (see Figure 2, trend line 2). Patience and hope would have been well rewarded in this instance because the up trend was not over. The RSI, which is displayed in the upper channel above price, shows that price continued to be overbought. Often this is not a bearish signal. The 50-day moving average was still above the 200-day moving average and rising. Price was still above both trend lines. |
|
| Figure 2. Daily chart of TSCO showing recent uptrend. |
| Graphic provided by: StockCharts.com. |
| |
| Trading can be difficult. Often we allow our emotions to control our trades. If emotions must control, then we must learn to reverse our natural impulses. Fear when we should hope and hope when we should fear. Good advice a hundred years ago, good advice today. |
Stella Osoba is a trader and financial writer. She is a frequent contributor to "Technical Analysis of Stocks and Commodities" magazine and "Traders.com Advantage" as well as other financial publications.
| E-mail address: | stellaosoba@gmail.com |
Click here for more information about our publications!
PRINT THIS ARTICLE

Request Information From Our Sponsors
- VectorVest, Inc.
- Executive Premier Workshop
- One-Day Options Course
- OptionsPro
- Retirement Income Workshop
- Sure-Fire Trading Systems (VectorVest, Inc.)
- Trading as a Business Workshop
- VectorVest 7 EOD
- VectorVest 7 RealTime/IntraDay
- VectorVest AutoTester
- VectorVest Educational Services
- VectorVest OnLine
- VectorVest Options Analyzer
- VectorVest ProGraphics v6.0
- VectorVest ProTrader 7
- VectorVest RealTime Derby Tool
- VectorVest Simulator
- VectorVest Variator
- VectorVest Watchdog
- StockCharts.com, Inc.
- Candle Patterns
- Candlestick Charting Explained
- Intermarket Technical Analysis
- John Murphy on Chart Analysis
- John Murphy's Chart Pattern Recognition
- John Murphy's Market Message
- MurphyExplainsMarketAnalysis-Intermarket Analysis
- MurphyExplainsMarketAnalysis-Visual Analysis
- StockCharts.com
- Technical Analysis of the Financial Markets
- The Visual Investor